

INP on WordPress: How to Find and Fix Slow Interactions
INP is good at 200ms or less at the 75th percentile. Find the interaction that is slow, trace what blocks the main thread, and fix that cause — not every…
Umair Khan •
To fix INP WordPress problems, find the slow interaction first, then trace it. Interaction to Next Paint, INP, is the Core Web Vital that measures how quickly a page responds to a visitor’s clicks, taps, and key presses. It replaced First Input Delay in March 2024, and the change matters: FID measured only the first interaction, while INP measures interactions across the whole visit, and reports the slowest ones.
That is why a site can feel fast on first load and still fail INP. A product page that loads quickly can still respond slowly when a shopper changes a variation, opens a filter, or clicks add to cart — if the main thread is busy with JavaScript, layout work, or a long task at that moment.
INP is good at 200 milliseconds or less, needs improvement from 200 to 500 milliseconds, and poor over 500 milliseconds, assessed at the 75th percentile of real user visits. That field assessment, from Chrome UX Report data over a rolling 28-day window, is what Search Console reports. A lab score on a fast machine is not a substitute for it. For measurement tools, see the best WordPress speed test tools.
What Causes Poor INP on WordPress?
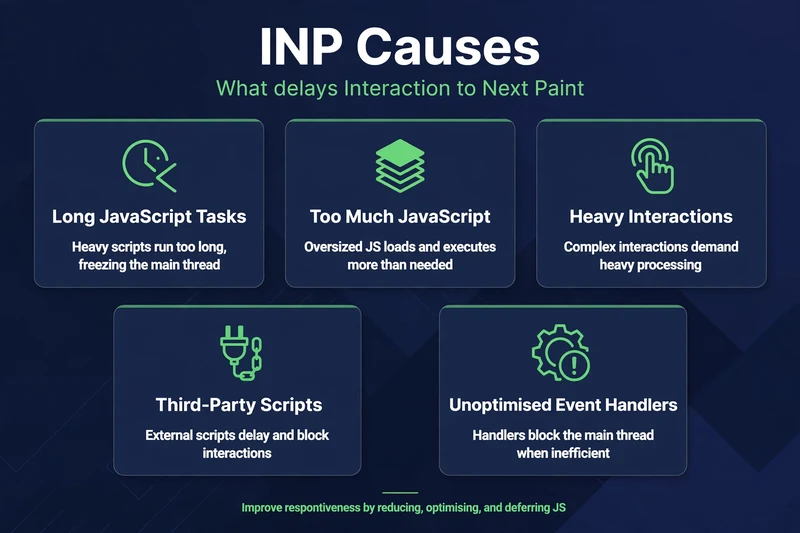
Poor INP is almost always a main-thread problem, not a server problem. The usual causes, in the order to check them, are:
- Long JavaScript tasks: a script that runs for hundreds of milliseconds blocks clicks, taps, and typing until it finishes.
- Too much JavaScript on the page: page builders, sliders, filters, and marketing scripts that all load and run on every page, even when their feature is not used.
- Heavy interactions: a click that triggers a large DOM update, a full re-render, or a slow query before anything paints.
- Third-party scripts: tag managers, chat widgets, and cookie banners that run on the main thread during an interaction.
- Unoptimised event handlers: handlers that do layout work, read and write the DOM in a loop, or wait on a network call before giving visual feedback.
Server response time still matters for loading, but a fast server does not fix a busy main thread. If INP is poor while LCP is good, look at JavaScript and interaction work first, not hosting.
How to Find the Slow Interaction
Do not start by disabling plugins at random. Find the interaction first, then trace it.
- Check field data: in Search Console, open the Core Web Vitals report and find which URL groups fail INP, on mobile and desktop separately. Note whether the failure is site-wide or limited to a template, such as product pages or checkout.
- Reproduce it: on staging, use the same page and the same interaction a visitor would use — change a variation, open a filter, click add to cart, submit a form. Time it by feel first, then with tools.
- Trace it in DevTools: in Chrome DevTools, record a Performance trace while you repeat the interaction. Look for long tasks on the main thread during that interaction, and which script, function, or layout work fills them.
- Isolate the component: from the trace, list the scripts and plugins behind the long tasks. Disable one suspect at a time on staging and re-trace the same interaction. The component whose removal shortens the long tasks is the lead, not just the trace.
- Check the field result, not just the trace: a faster trace on staging is a good sign, but the INP assessment is field data over 28 days. Record your own before-and-after field INP from Search Console after the fix has been live for a full reporting window, and do not claim a field improvement before that data exists.
Measure on your own site before publishing any INP number: record the failing URL group, the interaction, and the field INP before the fix, then the same field INP after a full 28-day window. Only that comparison counts as a before-and-after result.
Fixes Ranked by Impact
1. Reduce main-thread work on the interaction path
Split long tasks, defer work that is not needed for the interaction, and avoid running heavy code on every click. If a script does work that could wait until after the paint, move it there.
2. Load less JavaScript on the page
Remove scripts that load on pages where their feature is not used, and check page-builder and plugin settings for asset loading controls. Fewer scripts means fewer long tasks competing with the interaction.
3. Delay or defer third-party scripts
Load tag managers, chat widgets, and cookie banners after the interaction path is clear, or on user interaction where the tool allows it, and test that consent and tracking still work. A script that is not on the main thread during a click cannot block that click.
4. Make the interaction paint first
Give immediate visual feedback — a state change, a spinner, or an updated count — before the slow work runs. INP measures the next paint, so a fast first paint followed by background work feels and measures better than a long silent wait.
5. Fix the specific heavy interaction
For WooCommerce, that often means add to cart, variation changes, and mini-cart updates; for Elementor, it often means widget scripts and DOM size. Fix the specific heavy interaction, not every script on the site.
6. Check plugins last, not first
If the trace points to one plugin, check its settings first: does it need to run on that page, does it add scripts to every interaction, is there an update that fixes the cost? Replace it only after settings and staging tests fail.
Caching helps loading, not a busy main thread. For cache options, see the best WordPress cache plugins review.

Common INP Mistakes
- Chasing a lab score while field INP stays poor. Lab tools cannot reproduce every real interaction on every real device.
- Disabling five plugins at once and claiming a win. You will not know which one mattered.
- Delaying a script that breaks the interaction it was meant to support, such as a consent banner or a form handler, without testing it.
- Fixing LCP and assuming INP follows. They are different metrics with different causes.
- Claiming a field INP improvement from a single lab run. Field INP needs a full reporting window.
Related in this series: Core Web Vitals 2026 myth-bust, WooCommerce Speed Optimization pillar guide, and Query Monitor tutorial.
Common Questions
Frequently Asked Questions
Straight answers about what INP measures, why interactions feel slow, and how to fix them in the right order.
Keep reading
-
PageSpeed Looks Good but Core Web Vitals Fail? Lab vs Field Data Explained
A good lab score does not always mean a passing Core Web…November 9, 2026 -

Are Google Fonts Slowing Down WordPress? How to Fix Slow, Shifting Text
Text that appears late, flashes, or jumps after loading can make a…November 5, 2026 -
WordPress Slow on Mobile Only? How to Find the Mobile-Only Cause
Your site feels fine on a laptop but slow on a phone….November 2, 2026
2 responses to “INP on WordPress: How to Find and Fix Slow Interactions”
-
[…] Next in this series: the Core Web Vitals pillar guide, and the INP pillar guide for WordPress. […]
-
[…] Vitals claims, see my Core Web Vitals 2026 myth-bust. For slow responses to clicks and taps, see my INP pillar. And if a slow tool result points to caching, see my best WordPress cache plugins […]
Leave a Reply