

Query Monitor Tutorial: Find Slow Queries, Hooks and Plugins in WordPress
Query Monitor shows which queries, hooks, and plugins ran on a page, and how long they took. Use it on staging to find the one cause, then fix that cause.
Umair Khan •
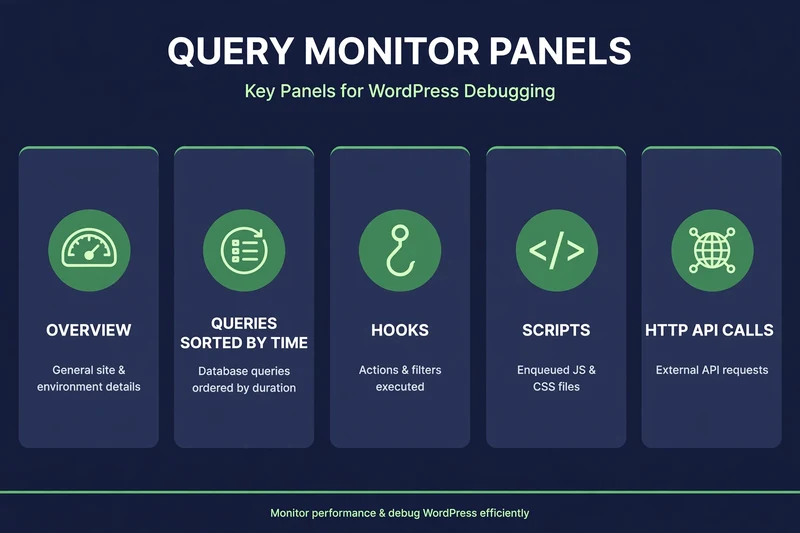
Query Monitor WordPress starts with evidence, not guesswork: most WordPress speed advice starts with “disable plugins” or “install a cache plugin,” but Query Monitor is a free debugging plugin that shows, for the page you are looking at, which database queries ran, which hooks ran, which plugins and theme files were involved, and how long each part took.
That matters because “WordPress is slow” is not a diagnosis. A slow query from one plugin, a hook that runs on every page, and a slow external call are three different problems with three different fixes. Query Monitor helps you tell them apart, on staging, before you change anything on live.
Query Monitor gives server-side timings. For shopper-side timings on the same page, use the best WordPress speed test tools.
Query Monitor WordPress: How to Install and Read It
Install it on staging, not live
Install Query Monitor from the WordPress plugin directory on a staging copy of your site. Activate it, and log in as an administrator. You will see Query Monitor in the admin bar, with the page generation time, database query time, query count, and memory usage for the current page.
Do not leave Query Monitor active on a live store for longer than you need it. It is a debugging tool, and its output can expose queries, paths, and internal details. Use it on staging, fix the problem there, then push the fix to live.
Read the panels in this order
Overview: total page time, database time, query count, and memory. If database time is a large share of total time, start with Queries. If database time is small but total time is large, look at Hooks, HTTP API calls, and Scripts.
Queries: every database query on the page, with time, caller, and component. Sort by time, slowest first. Look for one very slow query, the same query repeated many times, and queries with a large number of rows examined.
Hooks and Actions: which hooks ran, in what order, and which functions were attached to them. This is where you find a plugin doing work on a page where it should not run at all.
Scripts and Styles: which JavaScript and CSS files loaded, and which plugin or theme enqueued them. This helps with front-end bloat, but it is not the same as a slow query. Do not confuse a large script list with a database problem.
HTTP API Calls: external requests, such as license checks, font requests, or API calls to third parties. A slow external call can make a page feel slow even when your database is fast.
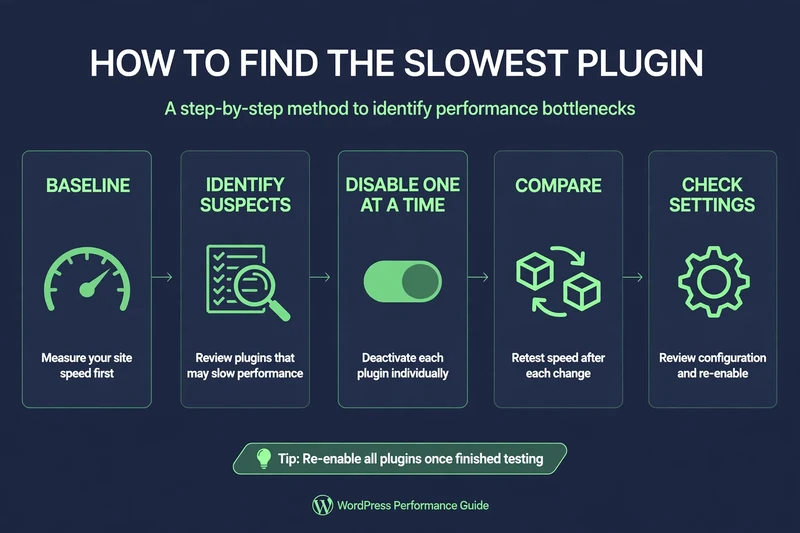
How to Find the Slowest Plugin
Query Monitor does not have a single “slowest plugin” score, and any tutorial that claims it does is oversimplifying. Use this method instead, one plugin at a time, on staging:
- Baseline: load the slow page — for WooCommerce, a product page, cart page, or checkout page — and note total time, database time, query count, and the slowest queries and their callers.
- Identify suspects: from Queries and Hooks, list the components that appear in the slowest queries or hooks. Those are your suspects, not every plugin on the site.
- Disable one suspect: disable that one plugin on staging, reload the same page, and compare. If time drops measurably, that plugin contributed to the slowness. If it does not, re-enable it and move to the next suspect.
- Check settings before replacing: for the plugin that mattered, check whether it needs to run on that page, whether it has a setting to limit its queries, and whether an update fixes the cost. Replacing a plugin is a last step, not a first step.
- Repeat, but stop at the cause: most slow pages have one or two causes, not ten. Once you have found and fixed the main cause, re-profile. Further plugin disabling will show diminishing returns and more risk.
Example workflow, without naming a real plugin as a result: if the slowest query on checkout is called by a discount or upsell plugin, and disabling that plugin on staging cuts checkout database time, then that plugin’s checkout behaviour is the lead. Check its settings for checkout-only loading, or whether it queries all products on every checkout load. If the slowest query is called by WooCommerce core on a large order history, the lead is different: HPOS, database cleanup, or indexing, not a third-party plugin.
Record your own before-and-after overview for the same page on staging after disabling one suspect plugin: total time, database time, and query count before, and the same three numbers after. Only a measured improvement on your own staging store counts as a result.
Profiling a WooCommerce Page: A Worked Example
Take a WooCommerce product page with variations, as an example journey:
- Load the product page with Query Monitor on, as an administrator on staging.
- Check Queries sorted by time. Are variation queries, related product queries, or a plugin’s queries at the top?
- Check Hooks for plugins that run on product pages but do not need to: for example, a checkout-only plugin loading its data on every product page.
- Check Scripts for a gallery, filter, or upsell script that loads on every product page even when its feature is not used.
- Change variation, add to cart, and check the Network tab in browser developer tools for AJAX calls, including cart fragments, alongside Query Monitor’s page data.
That same workflow applies to checkout, cart, and admin. For admin, profile the orders list and order search specifically, because a plugin that is harmless on the frontend can be very expensive in admin.
Safe to Leave on Live Site?
Short answer: no, not as a permanent plugin.
Query Monitor is designed for administrators, and by default it only shows output to administrators, but it still adds overhead, and its output is sensitive. Leaving it on live risks exposing internal details if permissions are misconfigured, and it can slow the very pages you are trying to measure.
Safe workflow: install on staging, profile, fix, remove from staging and live, and only re-install briefly on live if a problem cannot be reproduced on staging, and only for administrators, for a short, monitored period, with output never shared publicly.
If you need ongoing monitoring on live, use a proper monitoring tool or host metrics, not a debugging plugin left on permanently.
Common Mistakes with Query Monitor
- Profiling as an administrator and assuming shoppers see the same time. Admin bar, admin-only plugins, and uncached admin views change timings. Profile logged-out where possible with frontend pages, and compare like with like.
- Disabling five plugins at once and claiming a win. You will not know which one mattered, and you may break a feature you needed.
- Treating query count as the only metric. One slow query can matter more than 100 fast queries.
- Fixing a query by hiding it with cache, without fixing the underlying plugin or code. Cache helps frontend pages, but it does not fix admin, checkout, or logged-in slowness. For cache options, see the best WordPress cache plugins review.
- Publishing Query Monitor screenshots with real customer, order, or path data. Always use a test store.
Related in this series: Slow WooCommerce Checkout with Query Monitor, Slow WooCommerce Admin and Orders Page, and WooCommerce Speed Optimization pillar guide.
Common Questions
Frequently Asked Questions
Straight answers about installing Query Monitor, reading its panels, and finding the plugin behind a slow page.
Keep reading
-

Best Hosting for WooCommerce: What to Check Before You Choose
What does WooCommerce hosting need to handle? A store is not a…October 27, 2026 -
Which WooCommerce Plugins Slow Down Your Store? How to Test, Not Guess
Why do plugins slow a WooCommerce store? To answer which WooCommerce plugins…October 27, 2026 -

WooCommerce Product and Category Page Speed: Fast Pages That Still Sell
Why are product and category pages slow? A slow WooCommerce product page…October 27, 2026
One response to “Query Monitor Tutorial: Find Slow Queries, Hooks and Plugins in WordPress”
-
[…] Next in this series: WooCommerce Speed Optimization – the complete 2026 guide, and the Query Monitor tutorial. […]
Leave a Reply