
What PageSpeed Insights Actually Measures
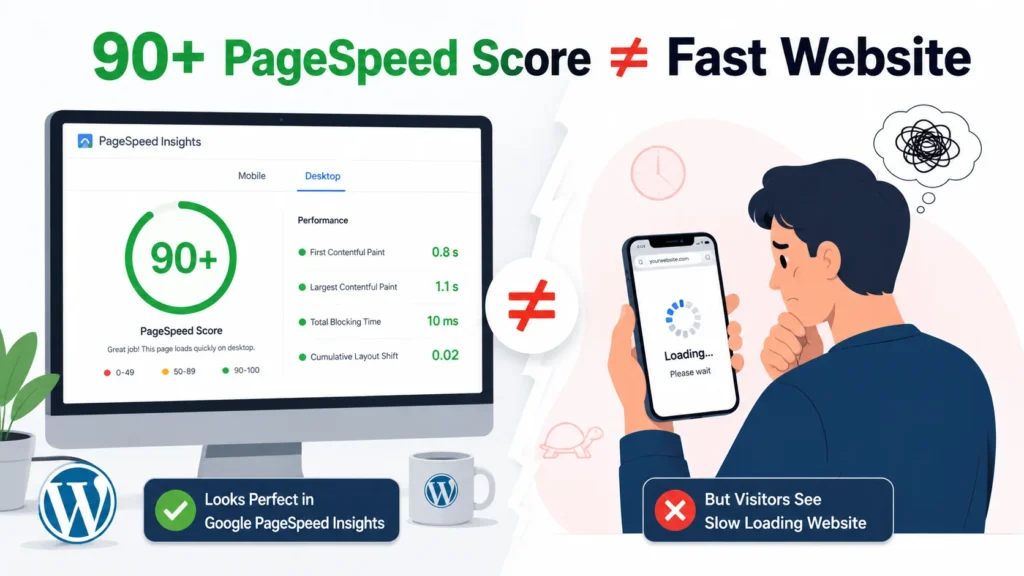
A PageSpeed score is useful, but it is not a stopwatch for your website. PageSpeed Insights combines Lighthouse lab testing with field information from the Chrome User Experience Report when sufficient real-user data is available. Google describes the PageSpeed Insights API as providing both Lighthouse lab data and real-world data, which is one reason you should look beyond the large score displayed at the top of the report.
The distinction matters because a performance score is produced from several measurements under a controlled test. It is not simply saying, “A visitor opened this website and it took X seconds to load.” Your actual visitors may be using an older Android phone, a slower mobile connection, a different browser configuration, or a network route that behaves very differently from the test environment.
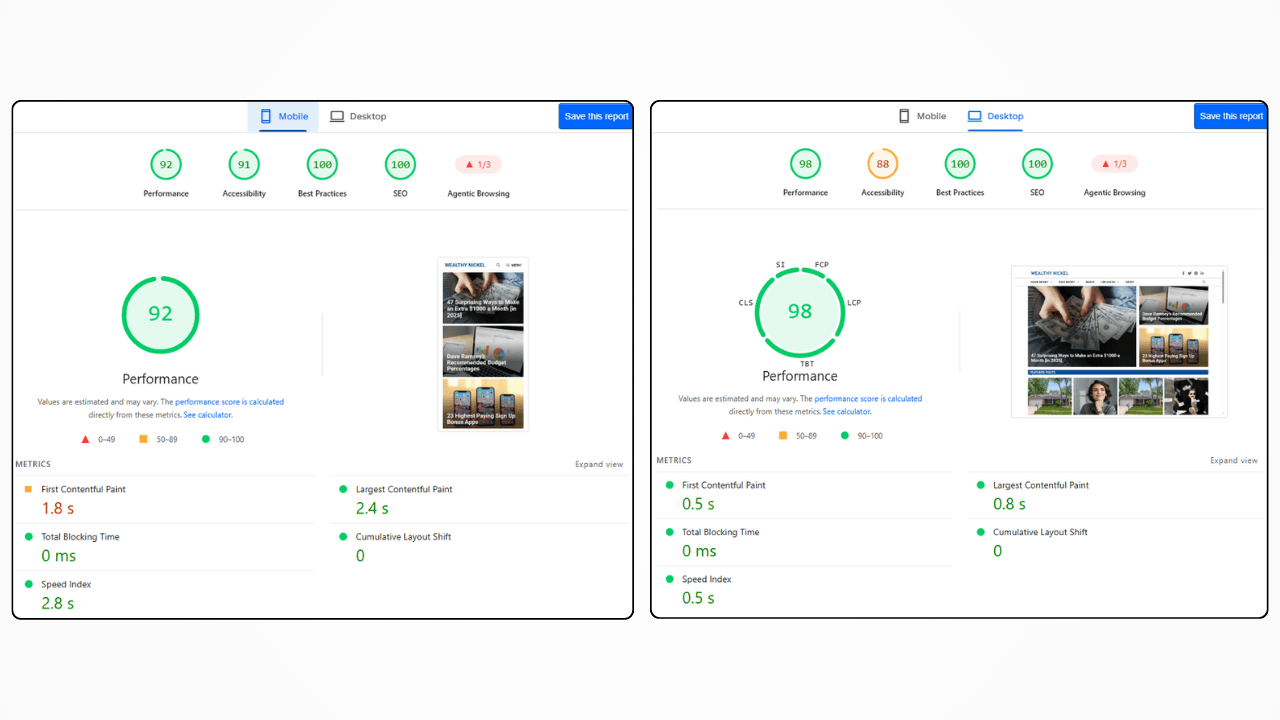
Think of the score as a diagnostic dashboard rather than the destination. A 92 tells you that the page performed well under that particular test configuration. It does not tell you that every visitor will see the page quickly, that every interaction will respond immediately, or that your WordPress backend is healthy.
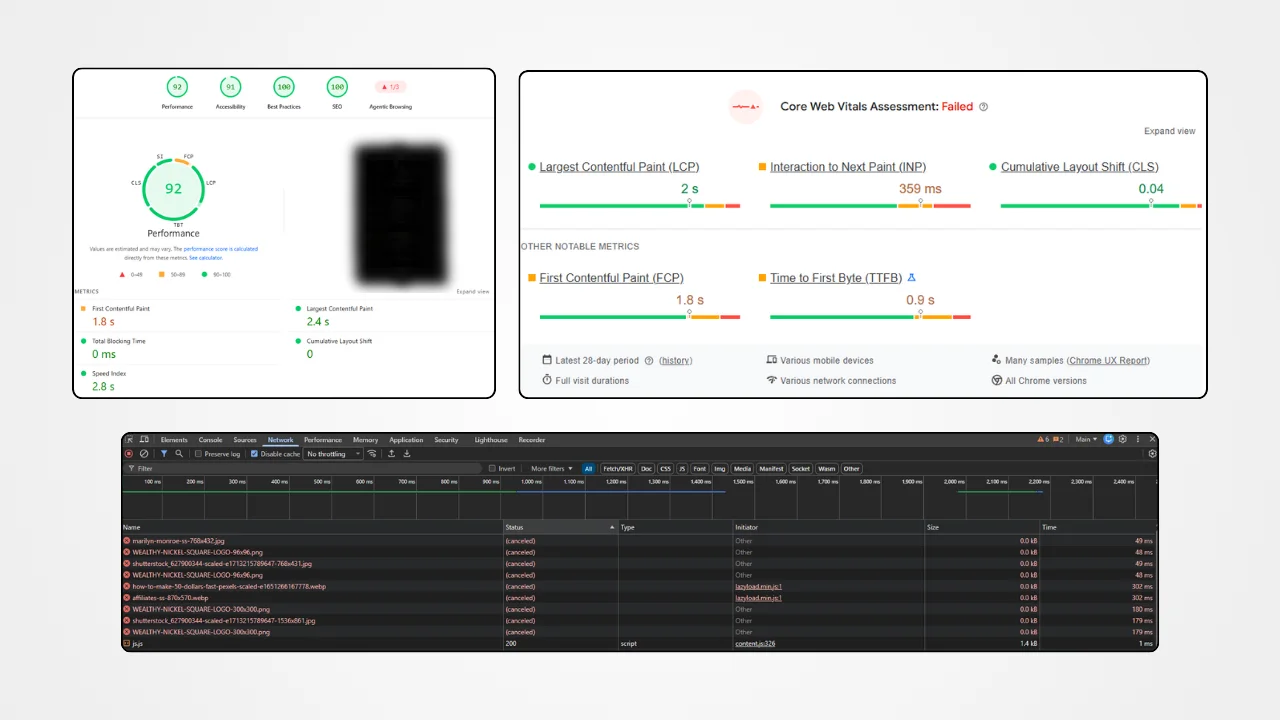
This is especially important for WordPress sites because the visible page is only the final result of many moving parts. Your hosting server, PHP execution, database queries, theme, plugins, CSS, JavaScript, images, fonts, CDN and third-party services can all influence the experience.
Lab Data vs Real User Data
Lab data is generated by Lighthouse in a controlled environment. It is extremely useful for finding opportunities because the conditions are repeatable. If you change your homepage and run the test again, you have a reasonable way to compare the before and after results.
Field data comes from actual users. It reflects real devices, networks and browsing conditions. Core Web Vitals are designed around real-world user experience, and Google uses the 75th percentile when evaluating whether the recommended thresholds are being met.
That creates a serious situation: you can have an excellent Lighthouse result while some of your visitors still have a poor experience.
Why the Two Results Can Look Completely Different
Imagine you test your WordPress website from a powerful desktop computer on a fast connection. The page may appear almost instantly. Now imagine a visitor opens the same page on a mid-range phone using a congested mobile network.
The HTML may arrive later. JavaScript may take longer to execute. A large hero image may take longer to decode. A cookie banner or marketing script may compete for the browser’s main thread.
The visitor experiences all of that. The 92 score does not magically remove those delays.
Why a High PageSpeed Score Can Still Feel Slow
The biggest mistake I see website owners make with performance testing is treating the score as the user experience itself. A page can score 90 or above and still have an obvious delay between the first visible part of the page and the rest of the content.
For example, the header might appear quickly while the main hero section takes another second or two to become useful. From the browser’s perspective, something has already been painted. From the user’s perspective, however, the website may still feel like it is loading.
This is where Largest Contentful Paint, or LCP, becomes much more useful than simply looking at the score. LCP attempts to identify when the largest visible image, text block or video has rendered, making it a better representation of when the main content becomes available. Google currently recommends an LCP of 2.5 seconds or less at the 75th percentile for a good experience.
There is another issue: a page can load visually and still feel sluggish when you try to use it. Clicking a menu, opening a popup, submitting a form or interacting with a slider can trigger JavaScript work. If the browser’s main thread is busy, the interface may hesitate.
That is why WordPress website speed should be evaluated as a complete experience rather than a single number.
Understanding Core Web Vitals
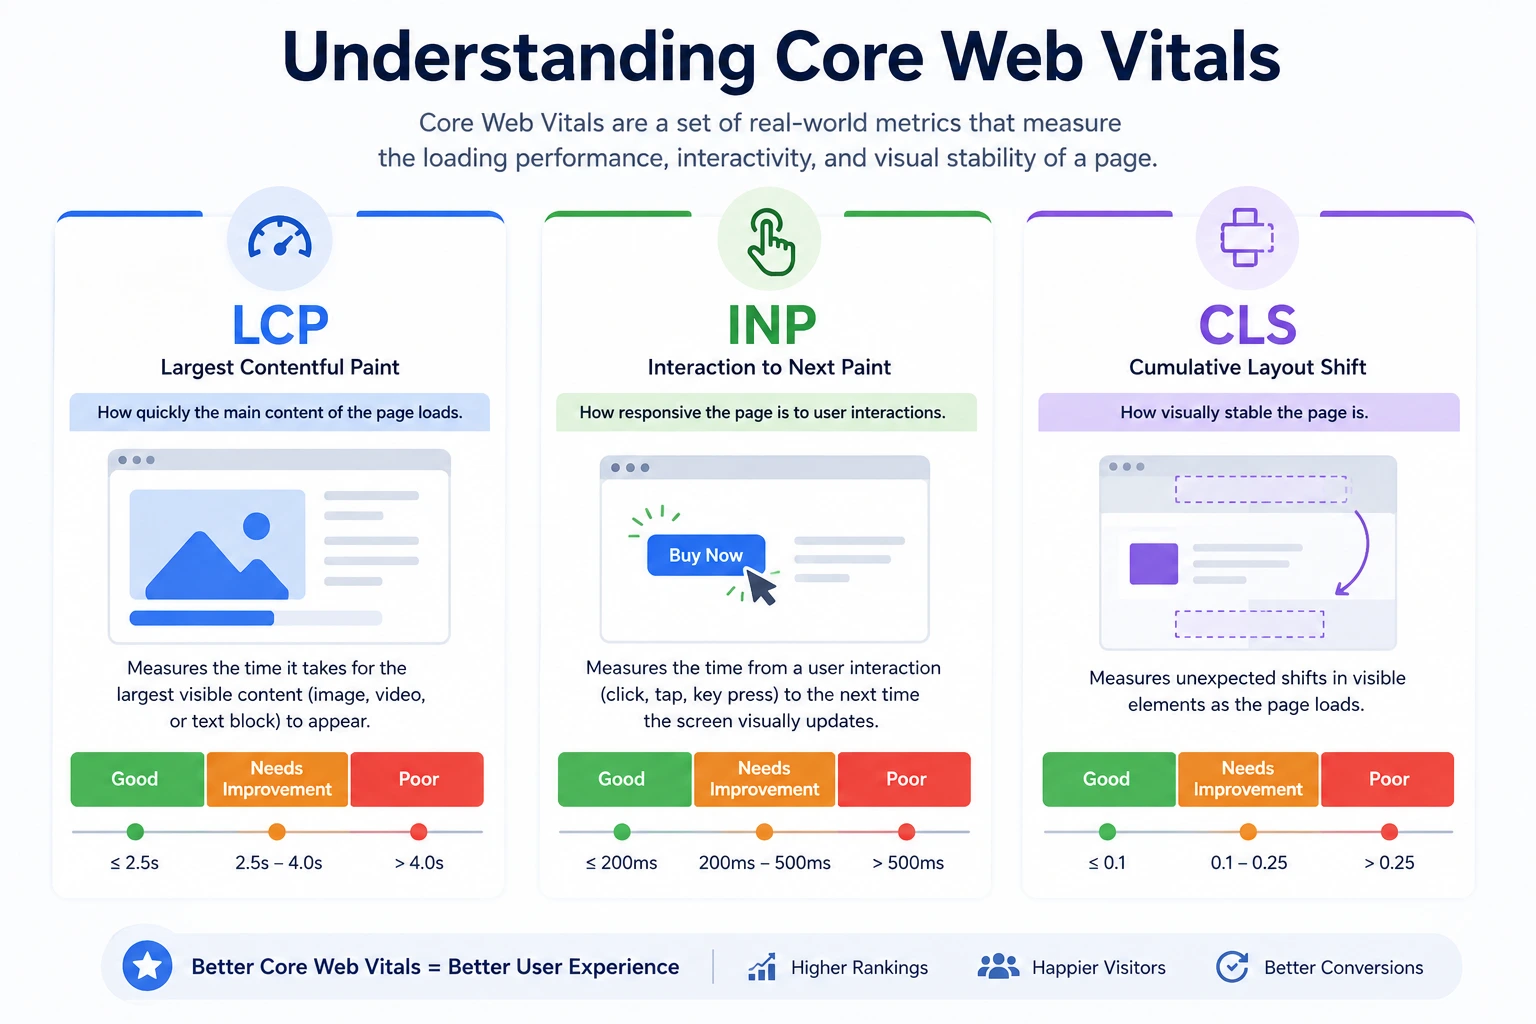
Core Web Vitals focus on three major parts of the experience: loading, responsiveness and visual stability. The current metrics are LCP, INP and CLS. Google recommends evaluating them at the 75th percentile rather than relying on one isolated test run.
LCP, INP and CLS in Plain English
LCP measures loading. It answers a practical question: when does the main content become visible? (LCP is related to but distinct from First Contentful Paint, which measures when any content first appears.) If your hero image is the largest element in the viewport, that image can become the LCP element. A slow server, poorly prioritized image, render-blocking resources or excessive client-side work can all push LCP later.
INP measures responsiveness. It is concerned with how quickly the page responds to user interactions. A website can look completely loaded and still have poor responsiveness because JavaScript is consuming too much main-thread time. Google currently considers an INP of 200 milliseconds or less a good result.
CLS measures visual stability. If content jumps while the visitor is reading or trying to click something, that is a layout shift. Images without reserved dimensions, dynamically inserted banners, advertising elements and some third-party embeds can contribute to the problem. A CLS of 0.1 or less is the current good threshold.
These metrics describe different problems. A page might have excellent CLS but terrible LCP. Another might load quickly but become unresponsive when several scripts execute. Looking at all three gives you a much better picture of WordPress performance.
TTFB and the WordPress Server
Time to First Byte, commonly called TTFB, measures how long it takes before the browser receives the first byte of the response. It is not the entire loading time, but it can establish a slow starting point for everything that happens afterward.
If your server takes 1.5 seconds to produce the initial response, the browser cannot display the HTML that it has not received yet. You can optimize CSS and compress images afterward, but you have already lost valuable time.
On WordPress, TTFB can be affected by hosting resources, PHP execution, database queries, uncached requests, plugins, theme logic, external requests and server configuration. Full-page caching can make a dramatic difference for cacheable pages, but caching should not be treated as a substitute for diagnosing the underlying site — see our full breakdown on how to reduce TTFB for the diagnostic steps.
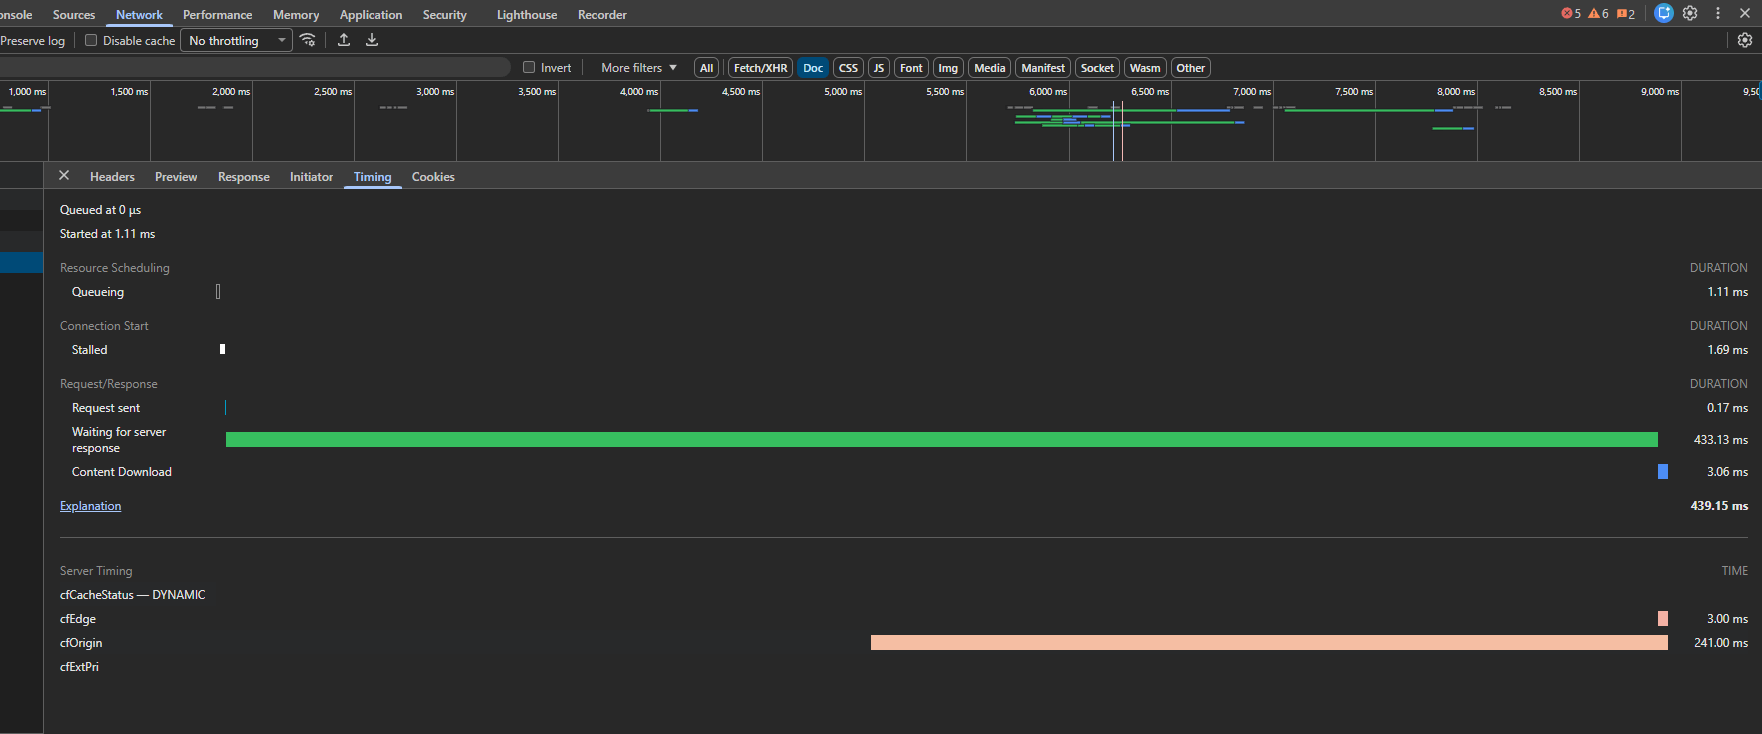
When investigating a slow WordPress website, I would not immediately start deleting plugins. First, I want to know whether the delay happens before the HTML arrives or after the browser receives it. That single distinction can save a lot of unnecessary optimization work.
Render-Blocking CSS and JavaScript
A browser cannot simply display everything as soon as it receives the HTML. It has to process resources, build the page structure, calculate styles and execute JavaScript.
Render-blocking CSS can delay the point at which the browser is ready to paint the page. JavaScript can create another problem by occupying the main thread while the browser is trying to render and respond to interactions.
This is why WordPress optimization plugins often provide options for delaying JavaScript, removing unused CSS or generating critical CSS. Those features can help; we cover the settings that actually move the needle in our guide to reducing total blocking time, but they need to be configured carefully.
One mistake I see often is enabling every optimization option at once and assuming more optimization must equal better performance. It does not. A script that is delayed incorrectly can break a navigation menu, form, checkout flow or interactive component.
The better approach is to identify which files are actually contributing to the problem. Look at the waterfall, inspect long tasks and determine what is needed during the initial render. Then make targeted changes and test again.
Large Images and Hero Sections
Images are one of the easiest ways to create a misleading performance problem. A homepage may have excellent caching and optimized CSS, yet still feel slow because the most important image is several megabytes or is being delivered at a much larger size than the visitor needs.
The hero section deserves special attention because it is often above the fold and frequently becomes the LCP element. If that image is requested late, lazy-loaded when it should not be, served at an excessive resolution or blocked behind unnecessary JavaScript, your LCP can suffer.
WordPress image optimization is not simply about reducing file size. You also need to consider dimensions, format, compression, responsive image delivery, loading priority and whether the image is actually necessary.
For example, a 2400-pixel-wide image displayed at 700 pixels wide on a phone is doing unnecessary work. The browser has to download more data than the visitor needs.
Third-Party Scripts Can Change the Experience
Analytics, advertising, chat widgets, heatmaps, social embeds, tracking platforms and marketing automation tools can all add JavaScript to a page.
The problem is not that third-party scripts are automatically bad. The problem is that every additional service has a performance cost somewhere. Some scripts download resources, some execute JavaScript, some create network connections and some modify the page after it has already started rendering.
A website can therefore have a good WordPress setup and still feel slower because of what has been added around it.
I usually look at third-party requests when a page looks optimized on paper but behaves differently in the browser. If removing or delaying one external script suddenly changes the loading timeline, you have useful evidence about the actual bottleneck.
The answer is not always “remove the script.” Sometimes it is better to load it later, restrict it to pages where it is needed, or replace it with a lighter implementation.
Why Mobile and Desktop Scores Differ
It is normal for mobile PageSpeed performance to be worse than desktop performance. A desktop computer generally has more processing power and a more capable network environment than a typical mobile device.
Google’s Core Web Vitals thresholds are not different for mobile and desktop, but the practical difficulty of meeting those thresholds can differ because mobile devices and networks are more constrained.
This is why I would never optimize a WordPress website by looking only at the desktop report.
A desktop score of 98 can look impressive while the mobile experience remains frustrating. If most of your visitors arrive from phones, the mobile report is much closer to the problem you actually need to solve.
When Should You Actually Worry About Your PageSpeed Score?
Do not panic because your score is 78, and do not relax simply because it is 94.
The score becomes useful when it helps you identify a meaningful performance problem. If your real users have poor Core Web Vitals, your pages take too long to become useful, interactions are delayed, or important content appears late, you have a problem even if the score looks respectable.
Likewise, if your site has a score in the 90s and users are genuinely having a fast experience, spending hours trying to push the number to 100 may provide very little practical value.
The thresholds are more meaningful than the obsession with the final score. For Core Web Vitals, Google currently identifies good results as LCP up to 2.5 seconds, INP up to 200 milliseconds and CLS up to 0.1.
What I Check When a WordPress Website Scores Well but Still Feels Slow
When a site scores well but feels slow, I start by reproducing the problem in an actual browser. I want to see what the visitor sees, not just what the Lighthouse report says.
Then I look at the Network panel in Chrome DevTools; this is one of several tools we rely on, alongside the others in our WordPress performance audit toolkit. The waterfall can reveal whether the delay comes from the initial HTML request, CSS, JavaScript, fonts, images or third-party resources.
Next, I inspect the Performance panel. Long JavaScript tasks can explain why a page looks loaded but does not respond immediately.
I also compare the homepage with other templates. If posts are fast but the homepage is slow, that usually points toward page-specific content, a builder section, hero media, widgets, forms, sliders or scripts that are only loaded there.
Finally, I compare desktop and mobile behavior and look at real-user data when it is available. The goal is not to collect a bigger score. The goal is to identify the bottleneck that a visitor is actually experiencing.
A Practical WordPress Speed Diagnosis Process
A useful performance audit should follow a logical sequence rather than jumping between optimization settings.
Start with the server response. Check TTFB and determine whether the page is being served from cache. If you’re choosing a caching plugin, our WordPress cache plugin comparison breaks down which one fits your setup. If the server is slow, front-end tweaks may only hide part of the problem.
Then inspect the rendering path. Find CSS and JavaScript that delay the first useful render. Check whether critical resources are being prioritized correctly and whether unnecessary assets are being loaded on the page.
After that, inspect images and fonts. Look specifically at the LCP element instead of compressing every image on the site without understanding which ones matter.
Next, review third-party scripts. Identify external domains, tracking scripts, chat tools, advertising systems and embedded services. Ask whether each one needs to load immediately.
Finally, test the page after every meaningful change. Performance optimization is much easier when you know which change produced which result.
This process is particularly important on WordPress because a plugin may not be the problem by itself. A plugin can be perfectly reasonable while its assets are being loaded on pages where they are unnecessary. The solution might be asset management rather than uninstalling the plugin.
Stop Chasing 100 and Start Measuring the Right Things
A perfect PageSpeed score is satisfying. It is also easy to chase because the number gives you an obvious target.
The problem starts when optimization decisions are made solely to improve that number. You can spend hours removing a few milliseconds from a lab test while ignoring a slow server, a massive hero image or a JavaScript-heavy third-party tool that visitors actually notice.
Instead, track Core Web Vitals, TTFB, LCP, responsiveness, visual stability and actual loading behavior. Compare those measurements across important templates and devices.
A useful performance target is not “make PageSpeed say 100.” A better target is “make the important pages consistently fast for real visitors.”
That difference sounds small, but it changes the entire optimization process.
Conclusion
A 90+ PageSpeed score is a good signal, but it is not proof that a WordPress website is fast. PageSpeed Insights is a diagnostic tool, and its lab environment cannot represent every device, connection and interaction experienced by your visitors.
The better approach is to look at the entire loading process. Check TTFB, identify the LCP element, understand JavaScript execution, inspect images, review third-party requests and compare mobile with desktop. When real-user Core Web Vitals data is available, use it because it tells you what visitors are actually experiencing.
At ProSpeedGuy, the useful part of a performance audit is not producing a pretty score. It is finding the reason a page is slow and fixing the bottleneck that matters. If a WordPress site scores well but still feels slow, a technical performance audit can be more valuable than another round of blindly changing PageSpeed settings.
FAQs
Is a 90 PageSpeed score good?
Yes, a 90 or higher is generally a strong Lighthouse performance score, but it does not guarantee that every visitor experiences a fast website. Check Core Web Vitals, TTFB and actual browser behavior alongside the score.
Why is my WordPress website slow when PageSpeed says 90+?
The issue may come from server response time, a slow LCP element, JavaScript execution, third-party scripts, large images or differences between the test environment and your real visitors. A high score does not eliminate these possibilities.
What is a good LCP for WordPress?
Google currently recommends an LCP of 2.5 seconds or less at the 75th percentile for a good user experience.
Is TTFB important for WordPress speed?
Yes. TTFB affects how quickly the browser receives the initial response. Slow hosting, uncached pages, PHP processing, database work and server configuration can all contribute to a high TTFB.
Should I try to get a PageSpeed score of 100?
Not necessarily. Once a website is performing well, chasing the last few points can become counterproductive. Focus on user-facing metrics and bottlenecks that affect real visitors.
Why is my mobile PageSpeed score much lower than desktop?
Mobile devices generally have less processing power and may use slower or less reliable networks. This can make JavaScript execution, image delivery and rendering more difficult, so desktop and mobile results can differ significantly.
How can I find what is actually making my WordPress site slow?
Start with PageSpeed Insights, then reproduce the issue in Chrome DevTools. Check the Network waterfall for server and resource delays, inspect the Performance panel for long tasks, identify the LCP element and review third-party scripts. Combining these tools gives you much more information than the score alone.