
Delivered Results for Speed Optimization Service
Speed Optimization is critical for your site – so we go beyond other providers
These are real-world results from real business websites using a variety of plugins, themes and hosting providers.
A lot of speed results you see around the web are where sites have had nearly all images and other elements on the page removed in order to achieve their fast load times. We don’t do any of that nonsense.
Fast load times are worthless if the website doesn’t convert visitors or market your business effectively. Our approach is a commercial, marketing first approach and balances the need for speed with the other business critical functions your website performs.
Generally speaking, speed and load times will vary depending on the time of day (time of day impacts server load) and the location of visitor or test tool but that said, these results are fairly typical when you use a high quality host in combination with our process.
Note that many of these results were tested using Pingdom’s speed test tool. Since Google released it’s Core Web Vitals metrics, we now focus on a number of metrics and not just simply “load time”.
In an ideal world we want our speed timings looking something like below which reflect a “good” score in Google’s Core Web Vitals:
-TTFB 0.1-0.2 seconds (this is where is should be in the country where the site is hosted, 0.2-0.5 internationally)
-FCP at or under 1 second
-LCP under 4 seconds but ideally as close to the LCP as possible, generally within 1 second of the LCP is fast
-load time 1.5-2.5
-fully loaded time can vary a lot depending on the third party code being used. Generally we’d expect to see it 1-2 second higher than the load time but this largely depends on the type of site, eg with a Woocommerce site this could easily be 3-5 seconds higher depending on the marketing code in use
Happy customers (before & after)
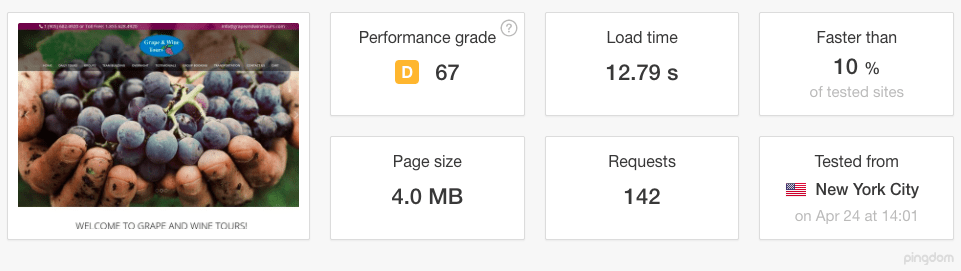
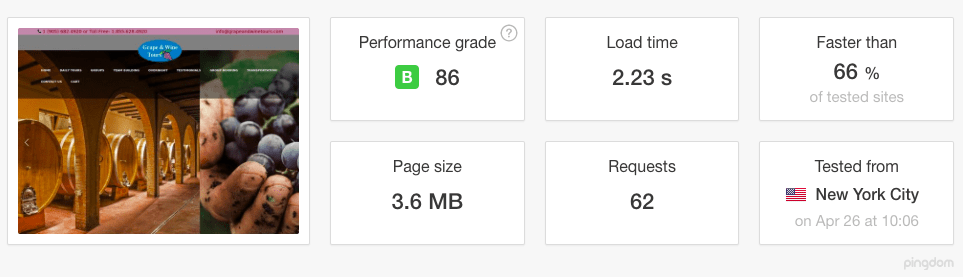
Super bloated site on awful shared hosting. Bloated WooCommerce site with pagebuilder. Sliders/carousels/animation elements, many 3rd party scripts and social calls. Took me a good couple hours trimming stuff out, and even resolving mixed content issues with old http links. The site is actually in Canada and loads faster for their local visitors. In real-time, loads went from about 8 seconds per click down to almost instantaneous.
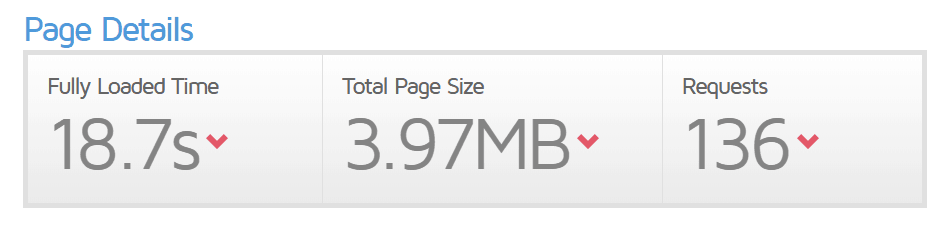
Incredibly laggy site. Had a booking system with tons of images and scripts. I was able to bring down the load times within a few hours of work.
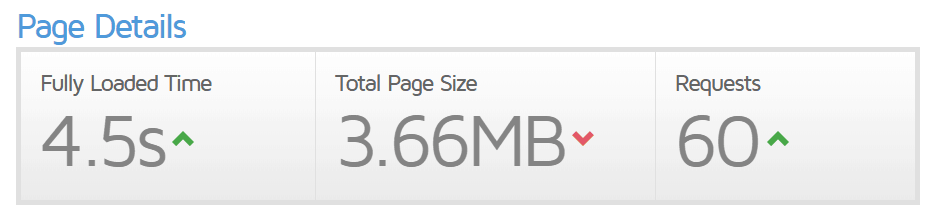
I’m always grateful to see happy customers and people who appreciate my work. Some jobs do take forever. 😍
Here’s another puzzle !
This was one of my best client’s site. She has a popular blog using bloated pagebuilder, with many images and 3rd party ad-scripts, also social embeds. Real-time loads went from 12 seconds per click down to instantaneous. I was able to bring her down to about 3-4 seconds on her previous shared hosting, then migrated her over to a VPS. The impressive thing is how fast her bloated pagebuilder was able to run. No loss in features or functions! (Her site has since been updated to a new theme.)
Umair is a very experienced and helpful WordPress expert who increased my site speed exponentially. My webpage went from 10-13 seconds on every click down to now instantaneous, even on my phone! The site is crazy fast, holy sh*t, insane. I had no idea my site could be this fast, it’s 1000 times better.
– Kristin Hanes
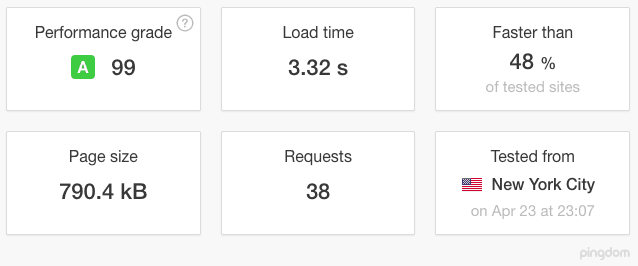
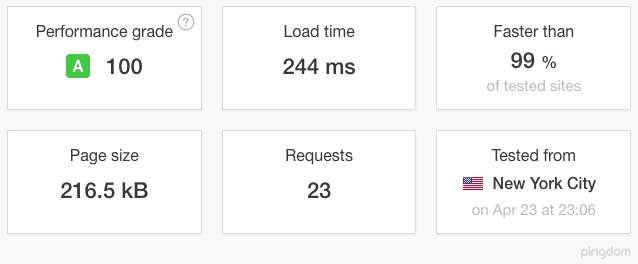
Super slow load times before. A client from USA, had LiteSpeed server & using LiteSpeed Cache plugin. He didn’t know how to configure it correctly.
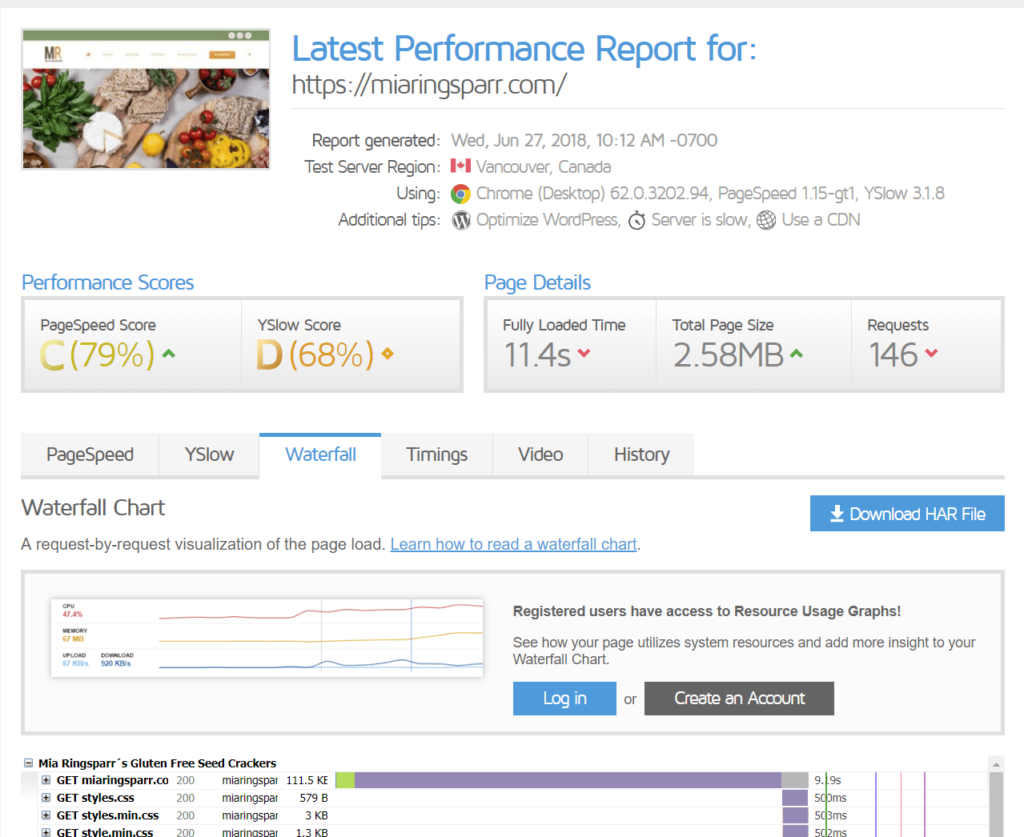
AND
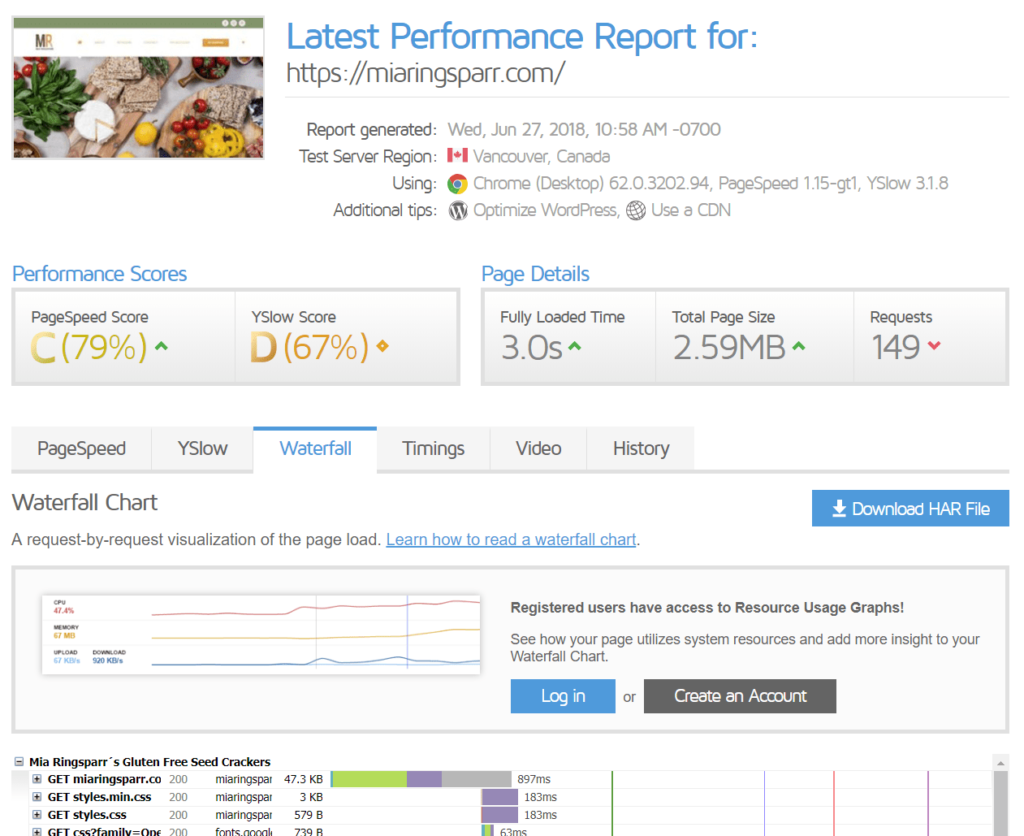
Instant speed improvement right after I re-configured his cache plugin. Notice how his initial http request went from nearly 10 seconds down to below 1 sec! Most of the site loaded immediately with only 3rd party assets dragging it out to 3 sec (but unnoticeable to users). This was a fun little project for me.
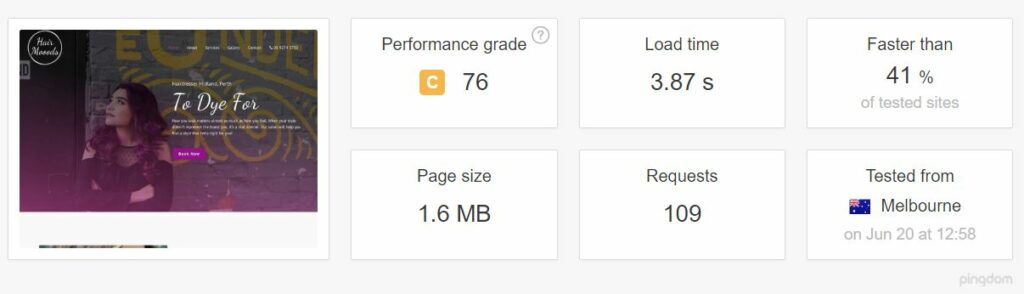
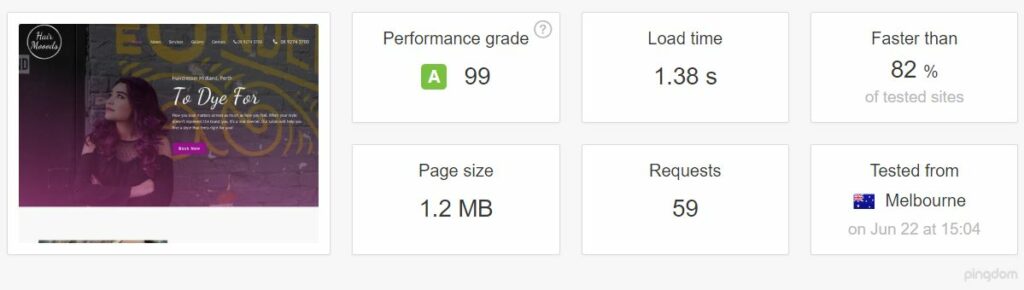
This local hair salon was crumbling with bloated scripts from pagebuilders and random little plugins they installed. I configured, reconfigured their theme and plugins, cleaned the database, dequeued unnecessary scripts and stylesheets, did even more housecleaning, and VOILA! The page load is faster on tests but in real world times, it feels much MUCH faster. It’s instant now!
CUSTOMERS LOVE US
I used WordPress Speed Optimization Service and which is 110% trustworthy. I’m really impressed, my website was a mess but Hafiz was great and I got an excellent result. I volunteered to give this review and asked Hafiz to send me a link to where I could write it.

I spent hours online researching who to hire to care for my website. I picked them and I just love working with them! They truly care for my site and have outstanding customer service. I highly recommend them to everyone!

In the last 60+ days, there hasn’t been a single failed response or issue not taken care of. Incredible customer service every step of the way. They always say they have your back and it really feels like it! Thanks We love you all!
