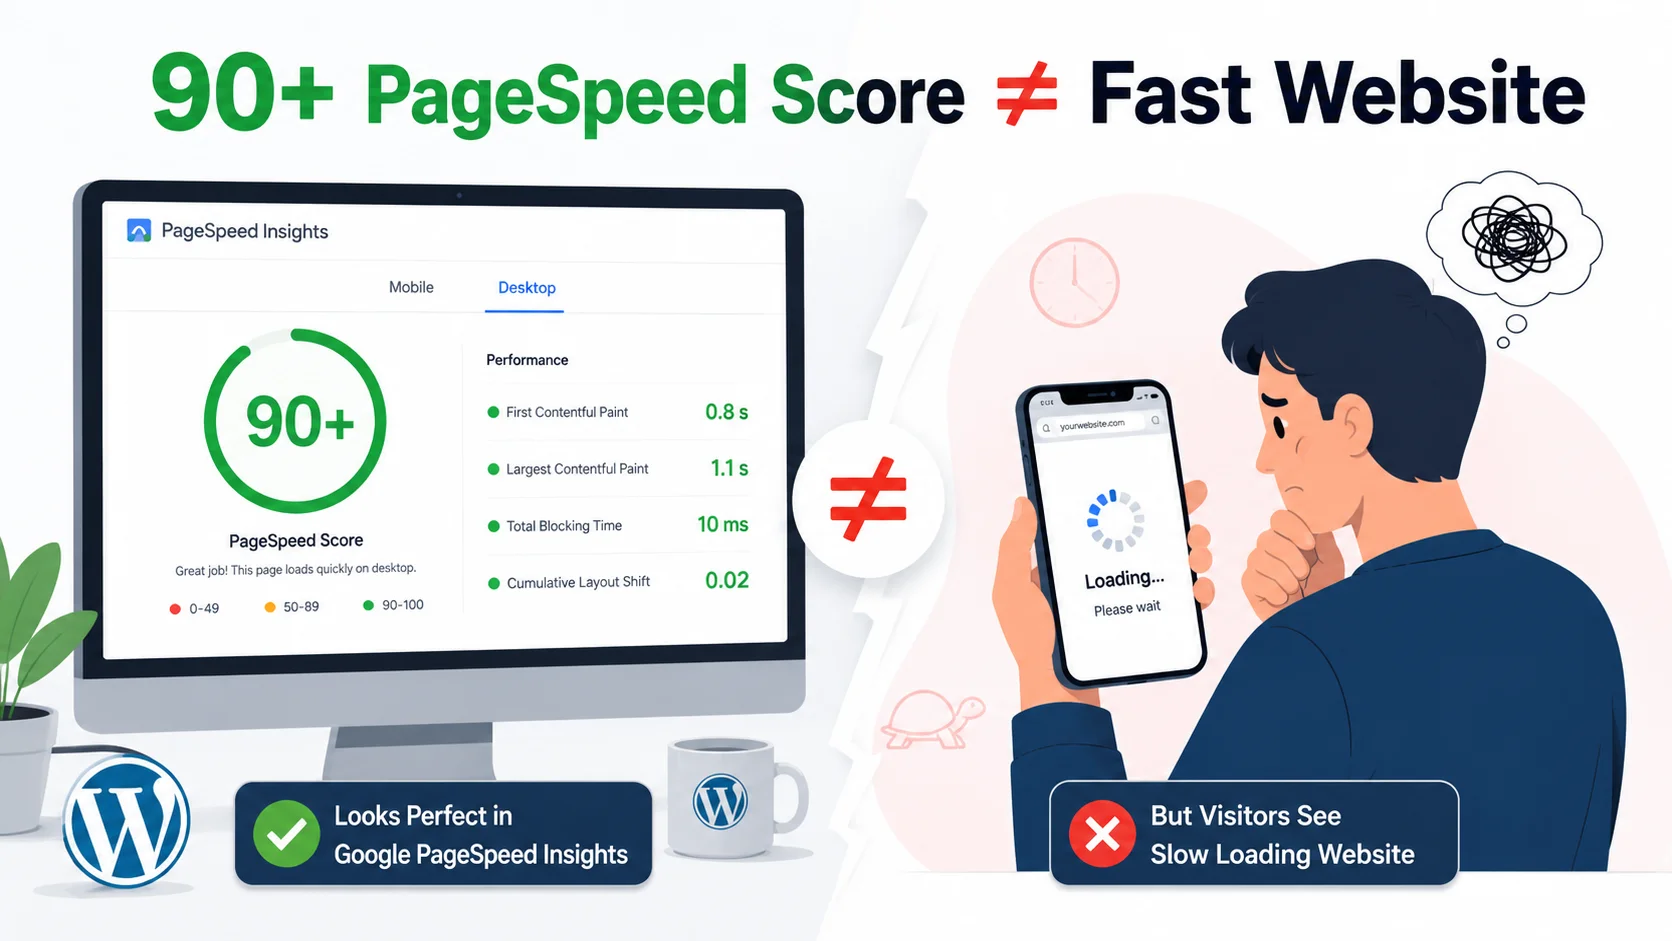
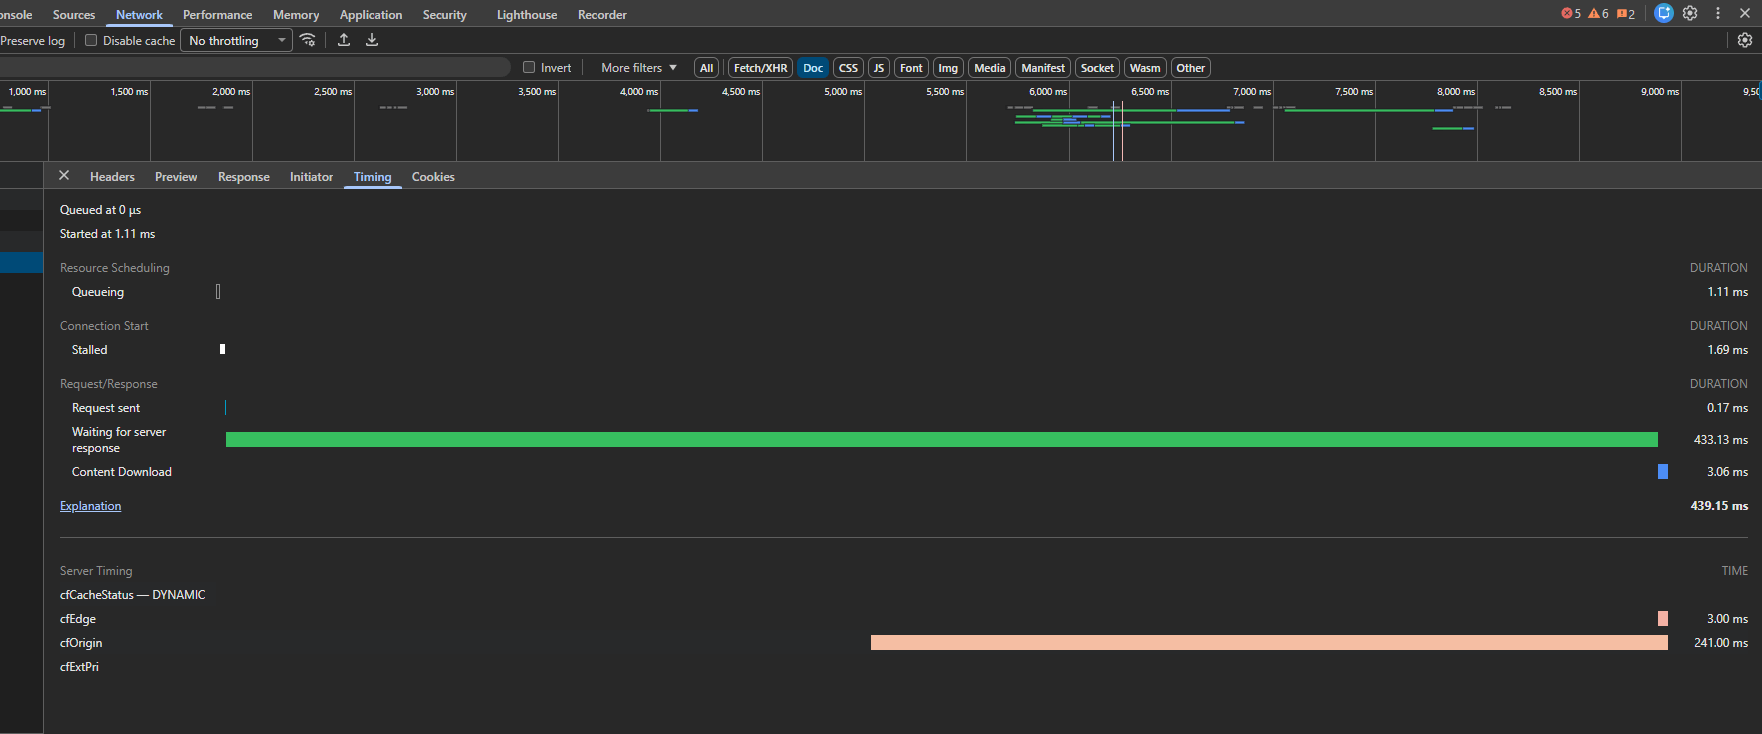
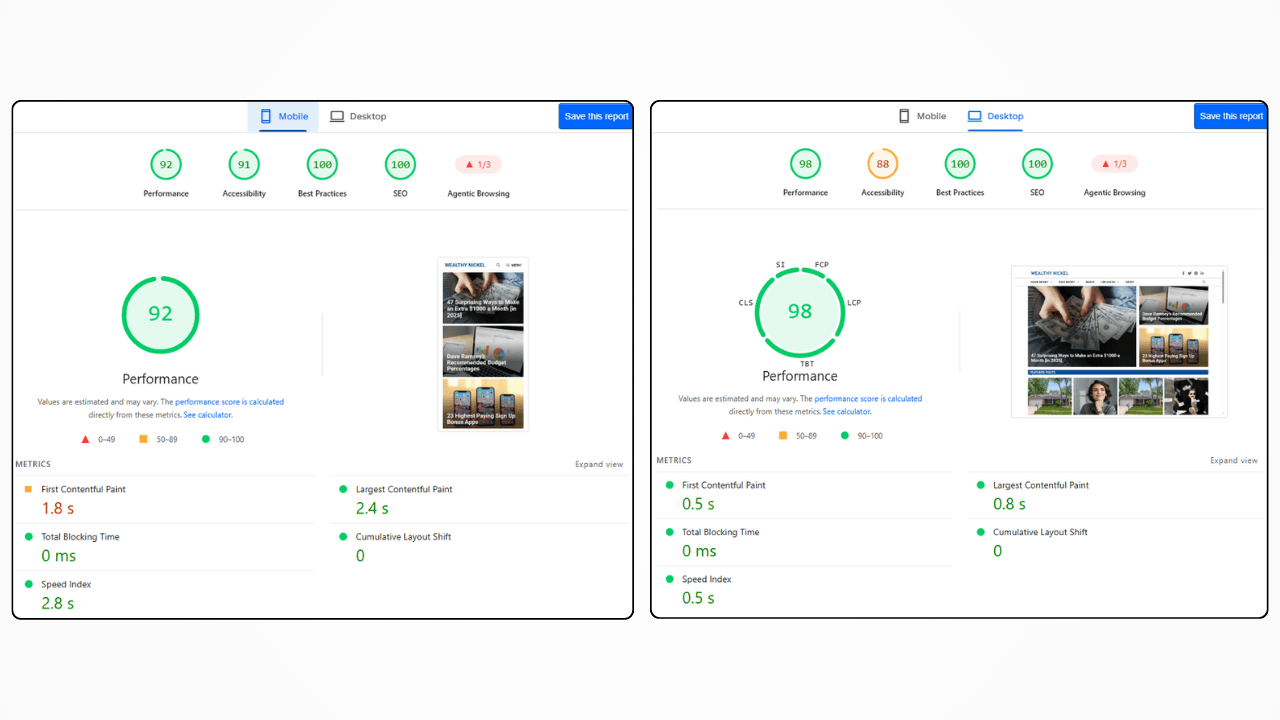
Your website may have beautiful design, strong branding, good services, persuasive copy, and clear calls to action. None of that matters much if potential customer taps your Google result on phone, waits, watches blank screen, tries to scroll, and leaves before page becomes usable. Mobile speed is not only technical SEO problem. It is lead generation problem. When page loads slowly, every form submission, phone call, booking, quote request, product purchase, and consultation opportunity sits behind unnecessary friction. That is exactly what our WordPress speed optimization services are designed to remove.
Google’s current web guidance treats Core Web Vitals as important user-experience measurements covering loading performance, responsiveness, and visual stability. Google also continues to treat INP as a Core Web Vital, replacing FID. But numbers only tell part story. Business owner does not lose lead because LCP number is 4.8 seconds. Business loses lead because person wanted answer now and website made them wait. That distinction matters when optimizing a real business website. You are not optimizing numbers for their own sake. You are reducing friction between customer intent and customer action.
Think about it like physical store. Customer walks through door and asks employee, “Can you help me?” Employee stares at them for five seconds before responding. Then every time customer touches product, employee freezes. Then checkout counter jumps sideways while customer reaches for wallet. Would customer trust store? Probably not. Slow website creates similar experience, except visitor can leave with one thumb tap and visit competitor.
Mobile Speed Is Now a Lead Generation Problem
Many businesses still treat website speed as something developers worry about after design is complete. Marketing team handles leads. Designer handles appearance. SEO person handles rankings. Developer handles speed. Problem: these things are connected.
Suppose local roofing company gets 1,000 monthly mobile visitors. Website receives traffic from Google, Facebook, paid ads, referrals, and Google Maps. Homepage loads slowly. Service pages contain huge images. Contact form loads several scripts. Phone button is buried below large hero section. User clicks “Get Free Estimate,” but JavaScript takes time to respond. Some visitors leave. Others never reach form. Business may blame ads, seasonality, weak offer, or poor traffic quality. Actual problem sits inside website experience.
Google’s older mobile-performance research found strong relationship between slower mobile experiences and user behavior. One Google/ SOASTA analysis reported that mobile pages loading one second faster saw up to 27% higher conversion rates, while bounce rates increased sharply as load time increased. Those figures come from older research, so they should not be treated as universal 2026 conversion benchmarks, but they demonstrate why performance can affect commercial outcomes.
Visitors Do Not Care Why Website Is Slow
Visitors do not know the website uses Elementor. Visitor does not know hosting company. Visitor does not know 47 plugins are active. Visitor does not know marketing team installed three tracking systems. Visitor does not know hero video is 8 MB.
Visitor sees one thing:
Website is slow.
That is all.
And visitor has options.
Google search result contains competitor. Browser back button works instantly. Search engine does not charge visitor for switching websites. There is no reason for user to wait patiently while your homepage negotiates with six third-party servers and downloads massive JavaScript bundle.
This is why speed optimization should begin with customer journey.
Find important pages. Find pages receiving mobile traffic. Find pages generating leads. Test those pages. Fix highest-impact bottlenecks first.
Do not spend three hours optimizing footer icon that contributes nothing to conversion while 2 MB hero image delays main content.
Why Mobile Users Leave Slow Websites
Mobile browsing happens under messy conditions. User may have weak Wi-Fi. User may use cellular connection. User may be commuting. User may have older phone. Browser may have limited resources. Battery may be low. Multiple apps may run in background.
Desktop test from fast office connection tells only small part of story.
Google’s mobile-speed research has repeatedly highlighted relationship between loading time and user behavior. Older Google research found that as mobile load time increased, probability of bounce increased substantially. Again, these are historical studies, not current universal thresholds, but underlying lesson remains useful: waiting creates friction.
Every Extra Delay Creates Friction
Imagine user wants emergency plumber.
They search:
“plumber near me emergency”
They tap result.
Website shows blank hero area.
Three seconds.
Five seconds.
Six seconds.
User goes back.
Next result loads quickly.
Lead gone.
No SEO report tells business owner which exact lead disappeared. Analytics may show landing-page exit. Ads platform may show click without conversion. CRM may show fewer calls. But root cause can sit between click and content.
Same thing happens with forms.
User sees:
Request Free Quote
Taps button.
Nothing happens.
Taps again.
Still nothing.
Then button finally opens modal.
User starts typing.
Keyboard causes layout shift.
Phone field refuses input.
User leaves.
You did not lose lead because offer was bad. You lost lead because interaction was painful.
Core Web Vitals and Lead Generation
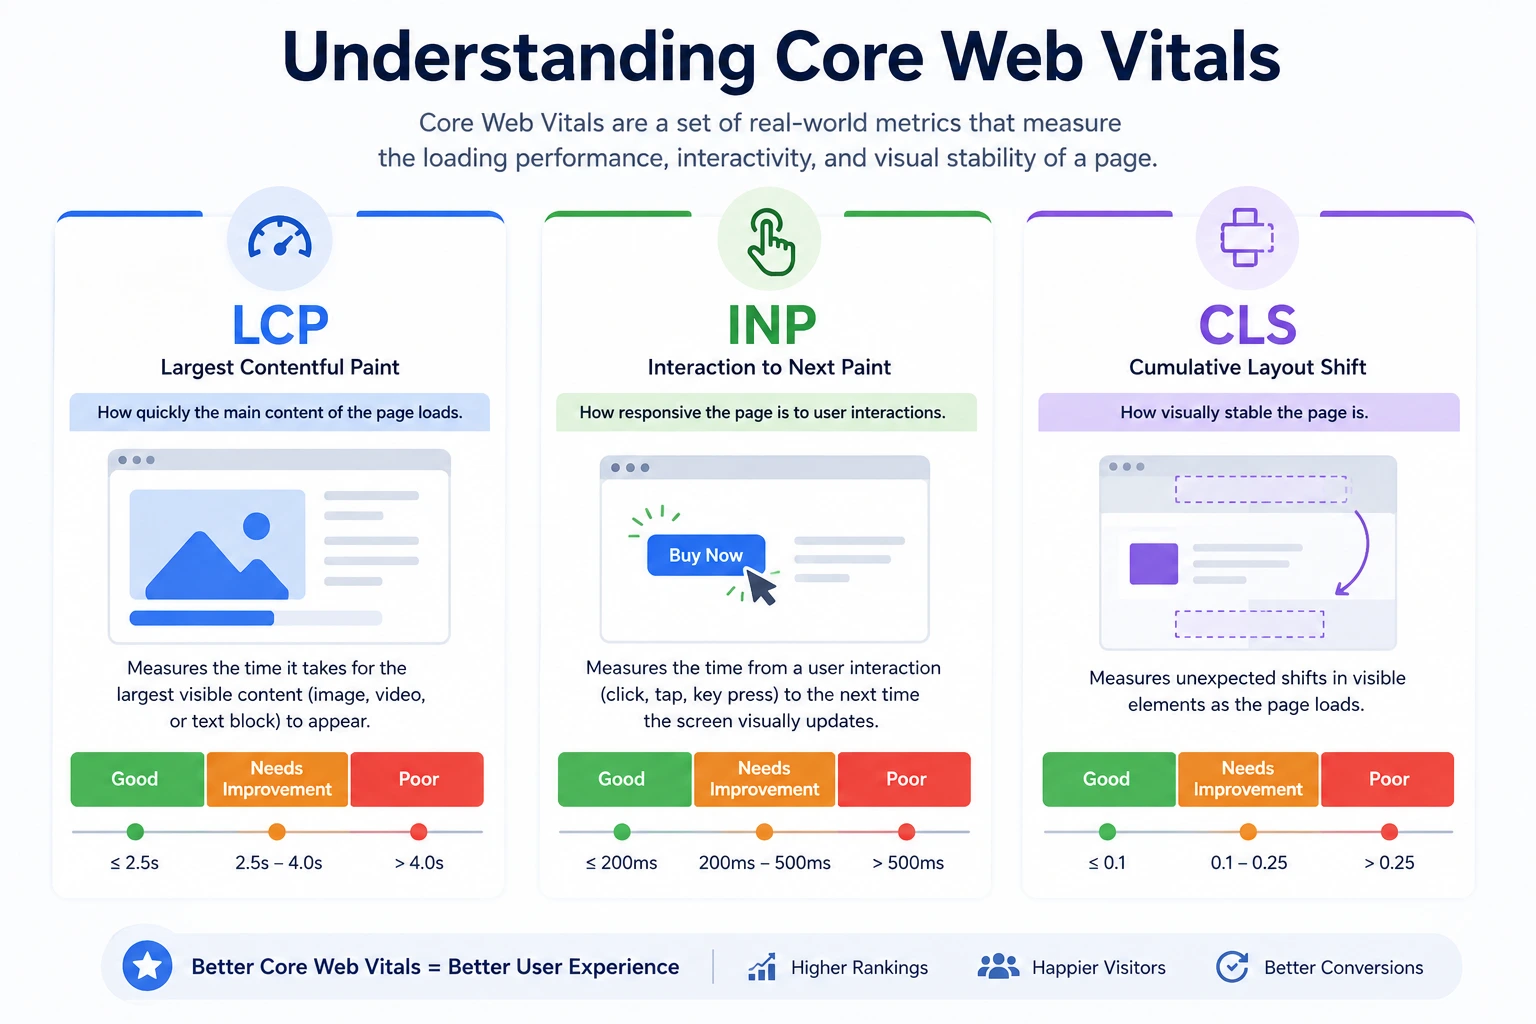
Core Web Vitals provide standardized way to measure important parts of user experience. Current Core Web Vitals include LCP, INP, and CLS. Google identifies these as loading performance, responsiveness, and visual stability measurements.
They are not complete website-quality score. Passing Core Web Vitals does not guarantee high conversion rate. Failing them does not automatically mean website cannot generate leads. But poor values can expose technical problems worth fixing.
For lead-generation website, think about metrics through customer actions.
LCP asks: Can visitor see main content quickly?
INP asks: Does website respond quickly when visitor interacts?
CLS asks: Does page stay visually stable while visitor uses it?
These questions map nicely to real-world behavior.
LCP, INP, and CLS Explained
LCP, Largest Contentful Paint, measures when largest content element in viewport becomes rendered. On many pages, that may be hero image, heading, or major content block. If LCP is slow, visitor may stare at incomplete page while browser works.
INP, Interaction to Next Paint, measures responsiveness to user interactions across page. High INP means clicks, taps, typing, menus, filters, or other interactions can feel delayed.
CLS, Cumulative Layout Shift, measures unexpected movement of content. Imagine trying to tap “Book Appointment” and button suddenly moves because image or ad loads above it. You tap wrong thing. That is not theoretical annoyance. It is poor interaction design.
Google’s current documentation confirms INP is now Core Web Vital and replaced FID.
LCP Can Delay First Impression
LCP often becomes biggest visible speed problem on marketing websites.
Large hero image. Background video. Slider. Custom font. CSS blocking render. Slow server. JavaScript-dependent hero section. Any combination can delay main content.
A website may technically start loading quickly while still feeling slow because meaningful content appears late.
Common WordPress LCP Problems
WordPress websites frequently create LCP problems through oversized hero images, background images loaded through CSS, sliders, page-builder markup, excessive CSS, web fonts, delayed image discovery, and slow server response.
Page builder itself is not automatically problem. Elementor, Divi, Gutenberg, Kadence, Bricks, and other systems can produce fast websites when used properly. Problem starts when page contains unnecessary layers.
For example, Hero section contains:
- Background image
- Overlay
- Heading
- Animated subtitle
- Button animation
- Decorative SVG
- Video
- Slider script
- Tracking script
User sees simple headline and button.
Browser sees entire orchestra.
Optimization asks: What does visitor actually need before taking action?
Maybe static optimized image beats video. Maybe heading can render without animation. Maybe unnecessary slider can disappear. Maybe critical CSS can load earlier. Maybe hero image needs proper dimensions and priority.
Do not optimize code blindly. Remove unnecessary work.
INP Can Kill Form and Button Interactions
A page can load quickly and still feel slow.
This happens when JavaScript blocks main thread.
User taps menu. Nothing.
User opens form. Delay.
User clicks calculator. Delay.
User selects product filter. Delay.
User types into field. Browser struggles.
This is where INP becomes relevant.
Large JavaScript bundles, third-party scripts, heavy animations, complex DOM, expensive event handlers, and poorly optimized page-builder code can all contribute to responsiveness problems. web.dev’s current performance guidance specifically provides optimization guidance for INP and identifies responsiveness as core part of web performance.
For lead generation, test actual interactions.
Do not only test homepage loading.
Click:
Menu → Service → CTA → Form → Submit
Watch what happens.
If every step feels delayed, speed problem is also conversion problem.
CLS Makes Website Feel Broken
Layout shift gets ignored because page can technically load fast while still behaving badly.
Imagine visitor lands on page. Heading appears. They start reading. Image loads above content and pushes heading downward. Visitor scrolls. Cookie banner appears. Content shifts again. Chat widget appears. Another element moves.
Now visitor has to visually chase page.
CLS is designed to measure this kind of unexpected movement. Stable layout is especially important for forms, buttons, navigation, and ecommerce controls.
Reserve space for images. Set dimensions. Avoid injecting content above existing content. Manage ads and embeds carefully. Load fonts without creating major layout movement.
Fast but unstable page still feels bad.
Why Mobile Speed Matters More Than Desktop Score
Desktop performance can create false confidence.
A powerful desktop computer connected to fast broadband can hide inefficient website architecture. Mobile hardware and network conditions expose it.
That is why you should inspect mobile performance separately.
Real Users Do Not Browse Like Lighthouse
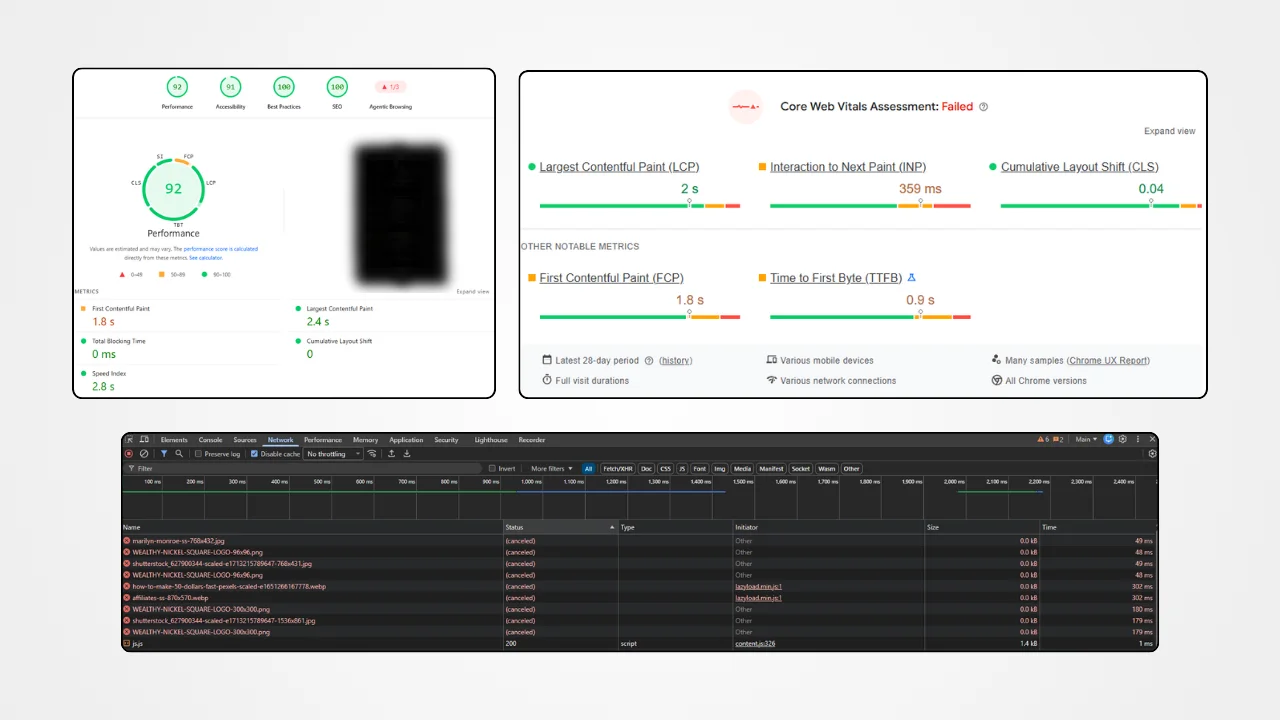
Lighthouse gives controlled lab measurements. Useful. Necessary. But not same as field data.
Real users have different devices, networks, locations, browsers, CPU speeds, and interaction patterns. Chrome User Experience Report data can provide field information for eligible pages and sites. Google also distinguishes lab testing from real-user measurements in its web performance guidance.
If you want to understand why chasing a perfect Lighthouse number can mislead you, read our breakdown of why PageSpeed scores don’t matter as much as most people think.
Use both.
Lab data helps identify technical opportunities.
Field data tells you what real users experience.
If PageSpeed says 95 but real-user data says important mobile pages struggle, do not celebrate number. Investigate.
If lab score is 62 but field data is healthy, inspect why lab environment differs before rebuilding entire site.
Numbers need context.
The WordPress Problems Making Your Site Slow
WordPress gives business owners huge flexibility. That flexibility can become performance debt.
Website may accumulate plugins over years.
Marketing adds popup plugin.
Designer adds slider.
SEO team adds schema plugin.
Developer adds custom scripts.
Tracking team adds analytics.
Agency adds optimization plugin.
Client adds chatbot.
Nobody removes anything.
Five years later, homepage loads 2 MB of JavaScript before visitor can click button.
Page Builders, Plugins, and JavaScript
Again, page builder is not automatically guilty.
Bad implementation is problem.
You can build fast website with page builder. You can build slow website with plain HTML. Technology choice matters, but architecture and implementation matter more.
Audit actual output.
Check CSS. Check JavaScript. Check DOM size. Check third-party resources. Check network waterfall. Check unused code. Check render-blocking resources. A good starting point is understanding how to properly minify CSS and JavaScript without breaking functionality or creating plugin conflicts.
Ask:
What is browser downloading?
Why is browser downloading it?
Does visitor need it immediately?
Can it load later?
Can it be removed?
Those questions often reveal bigger opportunities than installing another cache plugin.
Images Are Often Biggest Performance Problem
Images can make website beautiful.
They can also make website enormous.
A hero image uploaded directly from camera may be 5 MB. Website displays it at 1,200 pixels. Browser downloads 5 MB anyway unless responsive image strategy handles it properly.
Use modern image formats where appropriate. Resize images. Compress them. Serve responsive dimensions. Avoid loading below-the-fold images immediately. Preload or prioritize only genuinely critical resources.
Do not lazy-load everything.
If hero image is LCP element, lazy-loading it can delay LCP.
Optimization needs context.
Image optimization is not “compress every image and turn on lazy loading.”
It is deliver right image, right size, at right time.
Hosting and Server Response Time Matter
Frontend optimization cannot fix every backend problem.
If server takes too long to generate HTML, browser starts late.
Slow hosting. Poor database queries. Overloaded server. Bad PHP configuration. Unoptimized WooCommerce queries. Excessive plugins. External API calls. Cache misses.
All can contribute.
Time to First Byte, TTFB, is not Core Web Vital, but it influences how quickly browser can begin receiving page content and can affect LCP. web.dev’s current LCP guidance specifically emphasizes looking beyond image optimization and considering TTFB and resource-load delay.
For WordPress site, investigate hosting before blindly blaming frontend.
If server response is slow for cached pages, find the reason.
If uncached dynamic pages are slow, profile backend.
If only logged-in users experience delay, investigate a different caching path.
Third-Party Scripts Can Destroy Performance
Marketing scripts often receive free pass.
Chat widget.
Heatmap.
Analytics.
Ad pixel.
CRM.
Booking system.
Call tracking.
Social feed.
Review widget.
Cookie manager.
Each one sounds small.
Together they can create traffic jam.
Third-party JavaScript can consume network, CPU, and main-thread time. Some scripts also wait for external servers. If external service is slow, your website can feel slow. One practical step many WordPress site owners overlook is setting up cookie-free domains with Cloudflare to reduce request overhead and improve static asset delivery.
Audit third-party scripts.
Ask whether each one produces measurable business value.
If script generates one useful report per month but delays thousands of visitors, question it.
Do not remove analytics blindly. Measure dependencies first.
Why More Speed Plugins Do Not Always Fix Website
This is one of biggest WordPress misconceptions.
Website slow?
Install plugin.
Still slow?
Install another.
Still slow?
Install optimization plugin.
Now three plugins modify same CSS and JavaScript.
Result can become worse.
Caching, minification, delay, lazy loading, database cleanup, image optimization, CDN, and script management all have legitimate uses.
If you are evaluating a tool like NitroPack, understand what it does and does not handle before enabling every setting. But plugin settings can conflict. Some plugins duplicate functionality. Some features break forms or checkout.
Some optimization tools hide symptoms instead of fixing root cause. Speed optimization should be diagnostic. Find bottleneck. Fix bottleneck. Measure. Then move to next bottleneck. Do not turn website into plugin laboratory.
How Slow Website Hurts Local Lead Generation
Local service websites depend heavily on mobile visitors.
Person searching electrician, dentist, lawyer, HVAC company, plumber, roofing contractor, cleaning service, mechanic, restaurant, or clinic often wants answer quickly.
They may search while standing outside. They may need appointment. They may need phone number. They may need directions.
Website should make action easy.
If phone number appears after massive hero animation, problem.
If contact form takes ten seconds, problem.
If location page loads slowly, problem.
If map widget blocks rendering, problem.
If appointment calendar takes forever, problem.
Local lead generation has low patience threshold because user often has immediate need.
A slow website can waste traffic business already paid for through SEO, Google Ads, social media, directories, referrals, or Google Business Profile.
How Slow Website Hurts Ecommerce Conversions
Ecommerce has even more interaction.
Product page.
Gallery.
Variant selector.
Quantity control.
Add to cart.
Cart.
Checkout.
Payment.
Every interaction creates opportunity for latency.
Slow ecommerce website can also create trust problem. If product images jump around, cart takes time to update, checkout freezes, or payment button responds slowly, customer may wonder whether transaction is safe.
Do not test ecommerce only by loading homepage.
Test full buying journey.
Search → product → variant → cart → checkout → payment.
Measure each important step.
How to Test Mobile Website Speed Properly
Start with PageSpeed Insights.
Test homepage.
Then test high-traffic landing pages.
Then service pages.
Then contact page.
Then checkout or product pages if ecommerce.
Do not test only homepage because homepage is usually not where every lead lands.
Use Google Search Console to identify pages receiving impressions and clicks. Compare those pages with conversion data where analytics setup allows.
Lab Data vs Real User Data
Lab data gives controlled test conditions. Field data gives real-world experience.
Both have value.
Lab tests help developers diagnose.
Field data helps business understand actual visitors.
Core Web Vitals are based on real-user experience when field data is available, while tools such as Lighthouse provide lab measurements. web.dev recommends understanding both forms of measurement rather than treating one test as complete truth.
Also test multiple times.
Caching changes.
Network conditions change.
Third-party resources change.
Server load changes.
One test is snapshot.
Optimization needs trend.
How to Fix Mobile Speed Without Rebuilding Website
Many slow websites do not need complete rebuild.
Start with audit.
Find biggest problems.
If hero image is 4 MB, optimize image.
If server response is slow, investigate hosting and backend.
If 30 scripts load globally, reduce or conditionally load them.
If font files block rendering, improve font strategy.
If page builder generates unnecessary elements, simplify sections.
If plugin adds scripts site-wide but used only one page, restrict loading.
If third-party widget delays page, defer or remove it.
If CSS is huge, identify unused or unnecessary styles.
If JavaScript blocks interaction, reduce execution and break long tasks.
This can produce major gains without changing brand or rebuilding every page.
That is important for established businesses. Rebuild can introduce new bugs, SEO losses, migration issues, content problems, and unnecessary expense.
Optimize first.
Rebuild only when architecture itself prevents reasonable performance.
Mobile Speed Optimization Checklist
Before calling website “fast,” check these areas:
- Server: TTFB, hosting resources, caching, PHP, database
- Images: dimensions, compression, modern formats, responsive delivery
- LCP: hero element, render delay, image priority, CSS
- INP: JavaScript execution, event handlers, third-party scripts
- CLS: image dimensions, fonts, injected elements, dynamic content
- CSS: unused CSS, render-blocking styles, excessive framework output
- JavaScript: unnecessary libraries, long tasks, global scripts
- Fonts: file count, format, loading strategy
- Plugins: redundant or unnecessary plugins
- Third parties: chat, analytics, widgets, ads, social embeds
- Caching: page cache, browser cache, object cache where appropriate
- CDN: static delivery and geographic distribution
- Mobile UX: buttons, forms, navigation, readability
- Measurement: PageSpeed Insights, Search Console, field data, analytics
Do not blindly check boxes.
Prioritize problems based on business impact.
When Website Needs Full Technical Rebuild
Sometimes optimization reaches limit.
If theme is abandoned, codebase is heavily customized, templates are broken, plugin dependencies are impossible to untangle, backend architecture is obsolete, or site cannot support required functionality without excessive hacks, rebuild may make sense.
But rebuild should solve documented problem.
Do not rebuild because agency says “your website is old.”
Age alone does not make website slow.
A five-year-old optimized website can outperform brand-new bloated website.
Likewise, modern design does not automatically mean good performance.
Before rebuild, document:
Current traffic.
Current rankings.
Current conversions.
Current URLs.
Current Core Web Vitals.
Current integrations.
Current content.
Current backlinks.
Current technical issues.
Then create migration plan.
Protect what works while replacing what does not.
Conclusion
Your website does not need to be perfect to generate leads.
It needs to be fast enough, responsive enough, stable enough, and useful enough that visitor can reach answer and take action without fighting website.
That means stop treating mobile speed as PageSpeed score competition.
A score is a diagnostic signal.
Business outcome is the goal.
Google’s current web guidance continues to emphasize user experience and Core Web Vitals, while web.dev provides ongoing guidance around LCP, INP, CLS, field measurement, and performance optimization. Older Google research also provides useful evidence that mobile performance can influence bounce and conversion behavior, although those historical percentages should not be presented as universal 2026 benchmarks.
For WordPress businesses, biggest gains often come from removing unnecessary work rather than installing another optimization plugin.
Compress right images.
Fix slow server.
Reduce JavaScript.
Control third-party scripts.
Improve LCP.
Fix INP.
Prevent layout shifts.
Make forms respond quickly.
Test real user data.
Then measure leads.
Because final question is not:
“Did PageSpeed score go from 62 to 94?”
Better question:
“Can more visitors reach CTA and complete action without friction?”
That is speed optimization that matters. If you want us to find those friction points for your website, book a free call and we will walk through it together.
FAQs
1. Does mobile speed directly affect Google rankings?
Core Web Vitals are part of Google’s page experience signals, but Google does not say that passing Core Web Vitals guarantees higher rankings. Relevance and many other Search systems matter. Speed should therefore be treated as both user-experience and search consideration, not ranking shortcut.
If you are just getting started, our SEO tips for beginners cover the foundational signals Google uses to rank pages, including how performance fits into the bigger picture.
Google’s current documentation confirms INP is a Core Web Vital and continues to guide page experience.
2. What is a good Core Web Vitals result?
Current Core Web Vitals focus on LCP, INP, and CLS. Google and web.dev provide thresholds and measurement guidance for each metric. Passing all three gives useful signal that page meets Google’s “good” user-experience thresholds, but it does not guarantee good conversion rate or high search rankings.
3. Can WordPress website be fast with Elementor?
Yes. Elementor or another page builder does not automatically make a website slow. Performance depends on page structure, CSS, JavaScript, assets, plugins, hosting, third-party scripts, images, caching, and implementation. A poorly built Elementor page can be slow; a carefully optimized Elementor website can perform well.
4. Should I install more speed plugins if PageSpeed score is low?
No. First identify root cause. Multiple optimization plugins can duplicate features or create conflicts. Audit server response, images, CSS, JavaScript, fonts, third-party scripts, caching, and page architecture before adding another plugin.
5. How can I know if slow website is costing leads?
Connect performance data with analytics and conversion data. Compare mobile conversion rate, form completion, calls, bookings, e-commerce transactions, and landing-page exits against performance measurements. Test important pages before and after optimization. A speed improvement should ultimately be evaluated against user behavior and business outcomes, not PageSpeed score alone.