Category: Google Core Web Vitals

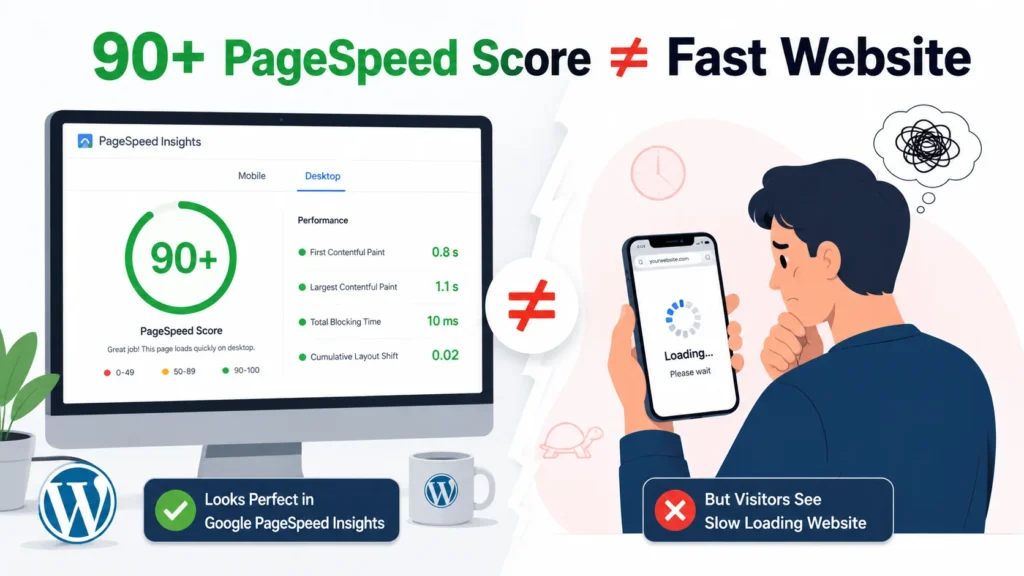
  • Why a 90+ PageSpeed Score Does Not Mean Your WordPress Website Is Fast

    Why a 90+ PageSpeed Score Does Not Mean Your WordPress Website Is Fast

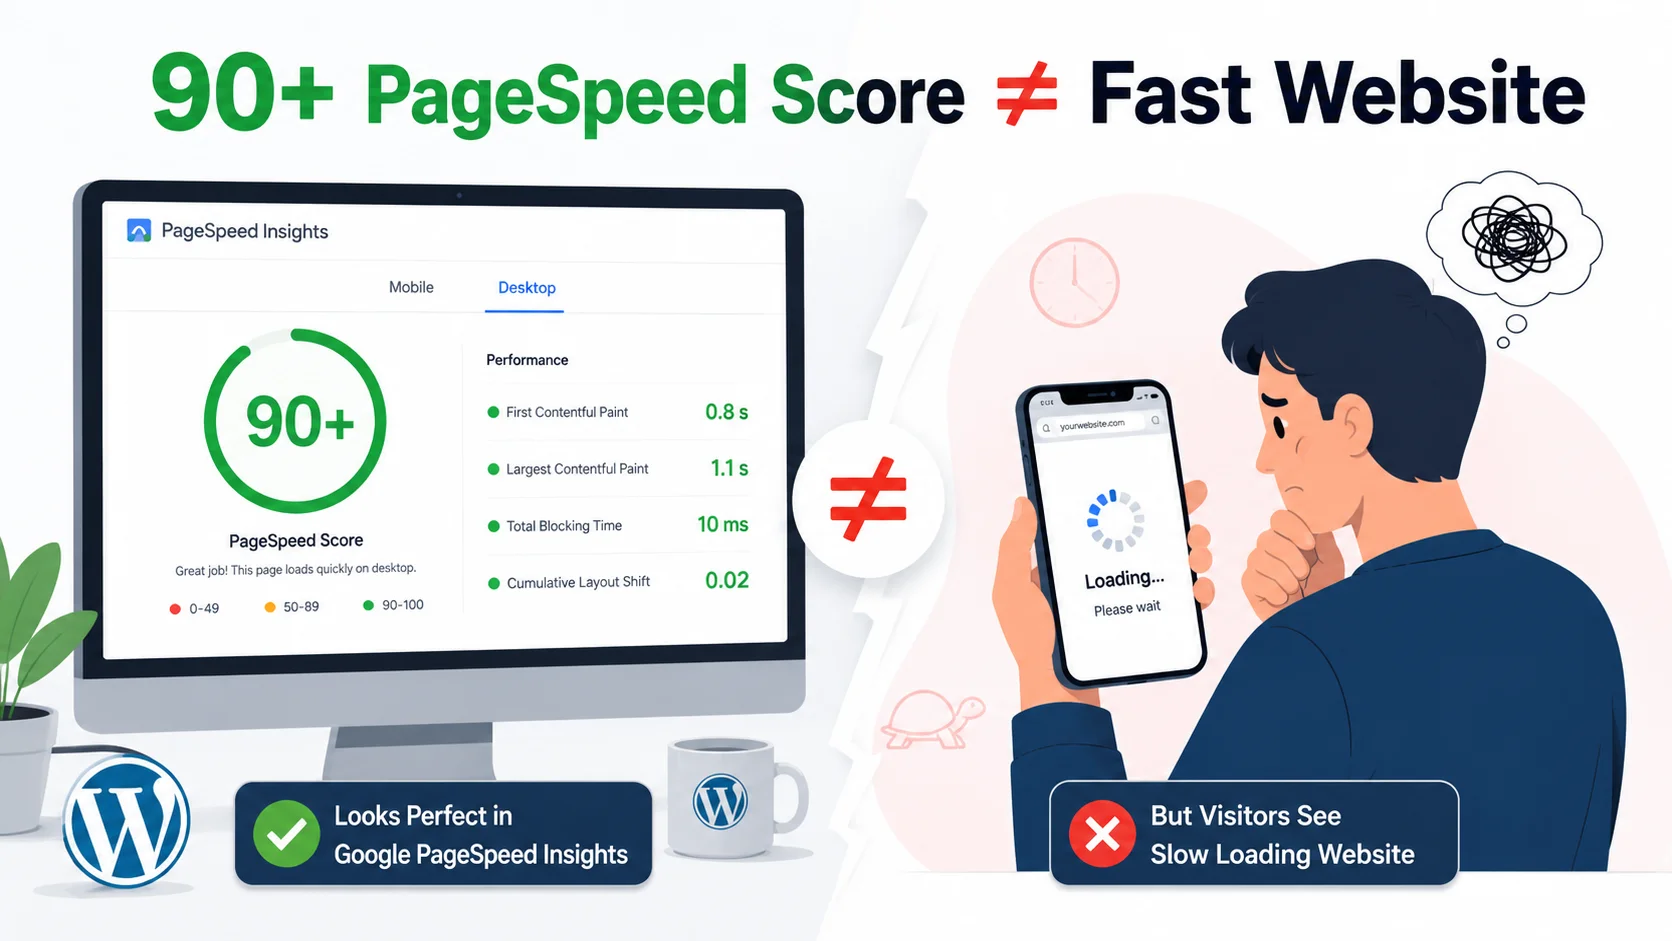
    Why a 90+ PageSpeed score does not always mean a fast WordPress website

    What PageSpeed Insights Actually Measures

    A PageSpeed score is useful, but it is not a stopwatch for your website. PageSpeed Insights combines Lighthouse lab testing with field information from the Chrome User Experience Report when sufficient real-user data is available. Google describes the PageSpeed Insights API as providing both Lighthouse lab data and real-world data, which is one reason you should look beyond the large score displayed at the top of the report.

    The distinction matters because a performance score is produced from several measurements under a controlled test. It is not simply saying, “A visitor opened this website and it took X seconds to load.” Your actual visitors may be using an older Android phone, a slower mobile connection, a different browser configuration, or a network route that behaves very differently from the test environment.

    Think of the score as a diagnostic dashboard rather than the destination. A 92 tells you that the page performed well under that particular test configuration. It does not tell you that every visitor will see the page quickly, that every interaction will respond immediately, or that your WordPress backend is healthy.
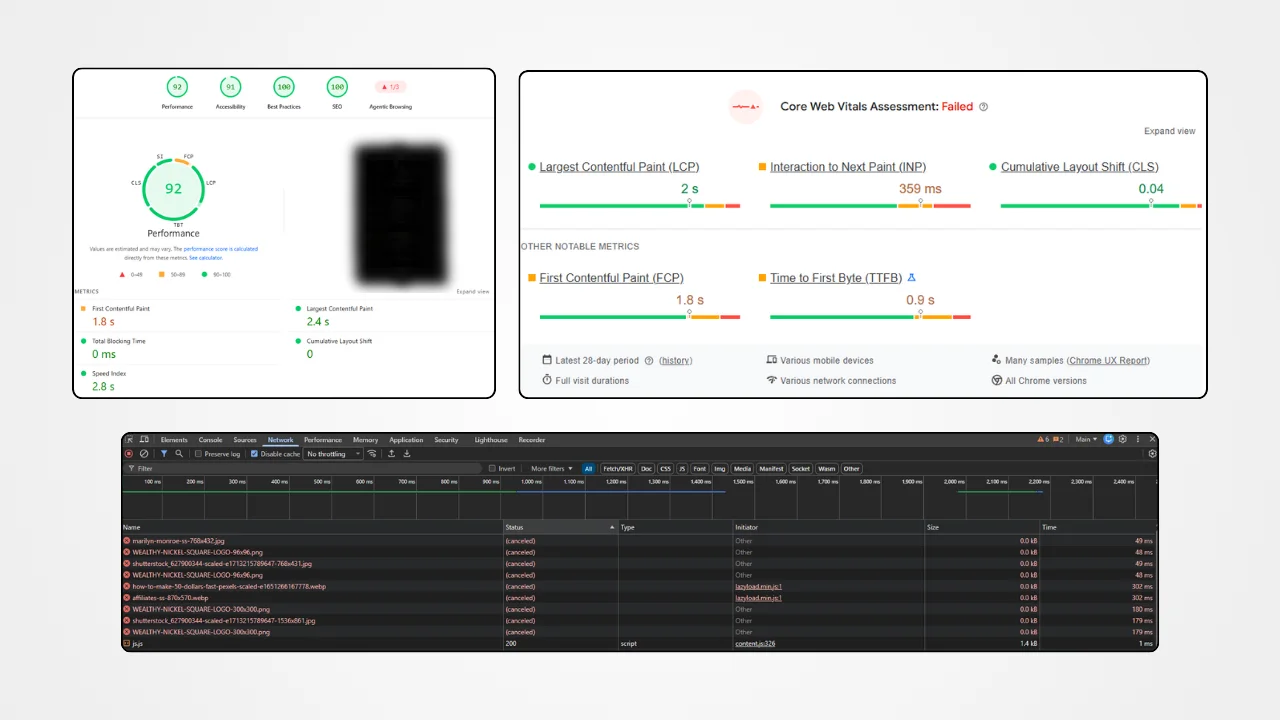
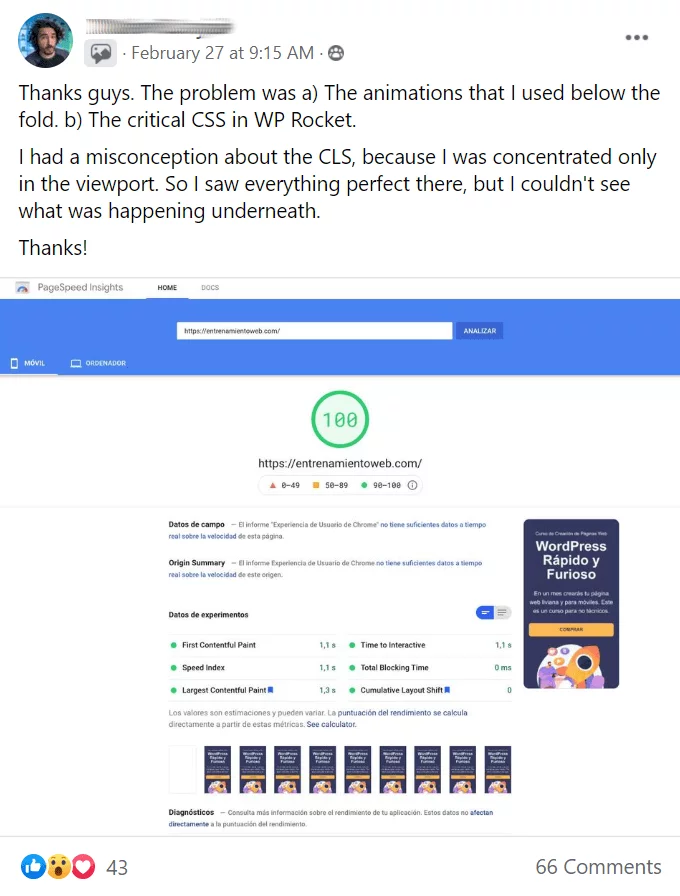
    PageSpeed Insights performance report showing Core Web Vitals and diagnostics

    This is especially important for WordPress sites because the visible page is only the final result of many moving parts. Your hosting server, PHP execution, database queries, theme, plugins, CSS, JavaScript, images, fonts, CDN and third-party services can all influence the experience.

    Lab Data vs Real User Data

    Lab data is generated by Lighthouse in a controlled environment. It is extremely useful for finding opportunities because the conditions are repeatable. If you change your homepage and run the test again, you have a reasonable way to compare the before and after results.

    Field data comes from actual users. It reflects real devices, networks and browsing conditions. Core Web Vitals are designed around real-world user experience, and Google uses the 75th percentile when evaluating whether the recommended thresholds are being met.

    That creates a serious situation: you can have an excellent Lighthouse result while some of your visitors still have a poor experience.

    Imagine you test your WordPress website from a powerful desktop computer on a fast connection. The page may appear almost instantly. Now imagine a visitor opens the same page on a mid-range phone using a congested mobile network.

    The HTML may arrive later. JavaScript may take longer to execute. A large hero image may take longer to decode. A cookie banner or marketing script may compete for the browser’s main thread.

    The visitor experiences all of that. The 92 score does not magically remove those delays.

    Why a High PageSpeed Score Can Still Feel Slow

    The biggest mistake I see website owners make with performance testing is treating the score as the user experience itself. A page can score 90 or above and still have an obvious delay between the first visible part of the page and the rest of the content.

    For example, the header might appear quickly while the main hero section takes another second or two to become useful. From the browser’s perspective, something has already been painted. From the user’s perspective, however, the website may still feel like it is loading.

    This is where Largest Contentful Paint, or LCP, becomes much more useful than simply looking at the score. LCP attempts to identify when the largest visible image, text block or video has rendered, making it a better representation of when the main content becomes available. Google currently recommends an LCP of 2.5 seconds or less at the 75th percentile for a good experience.

    There is another issue: a page can load visually and still feel sluggish when you try to use it. Clicking a menu, opening a popup, submitting a form or interacting with a slider can trigger JavaScript work. If the browser’s main thread is busy, the interface may hesitate.

    That is why WordPress website speed should be evaluated as a complete experience rather than a single number.

    Understanding Core Web Vitals
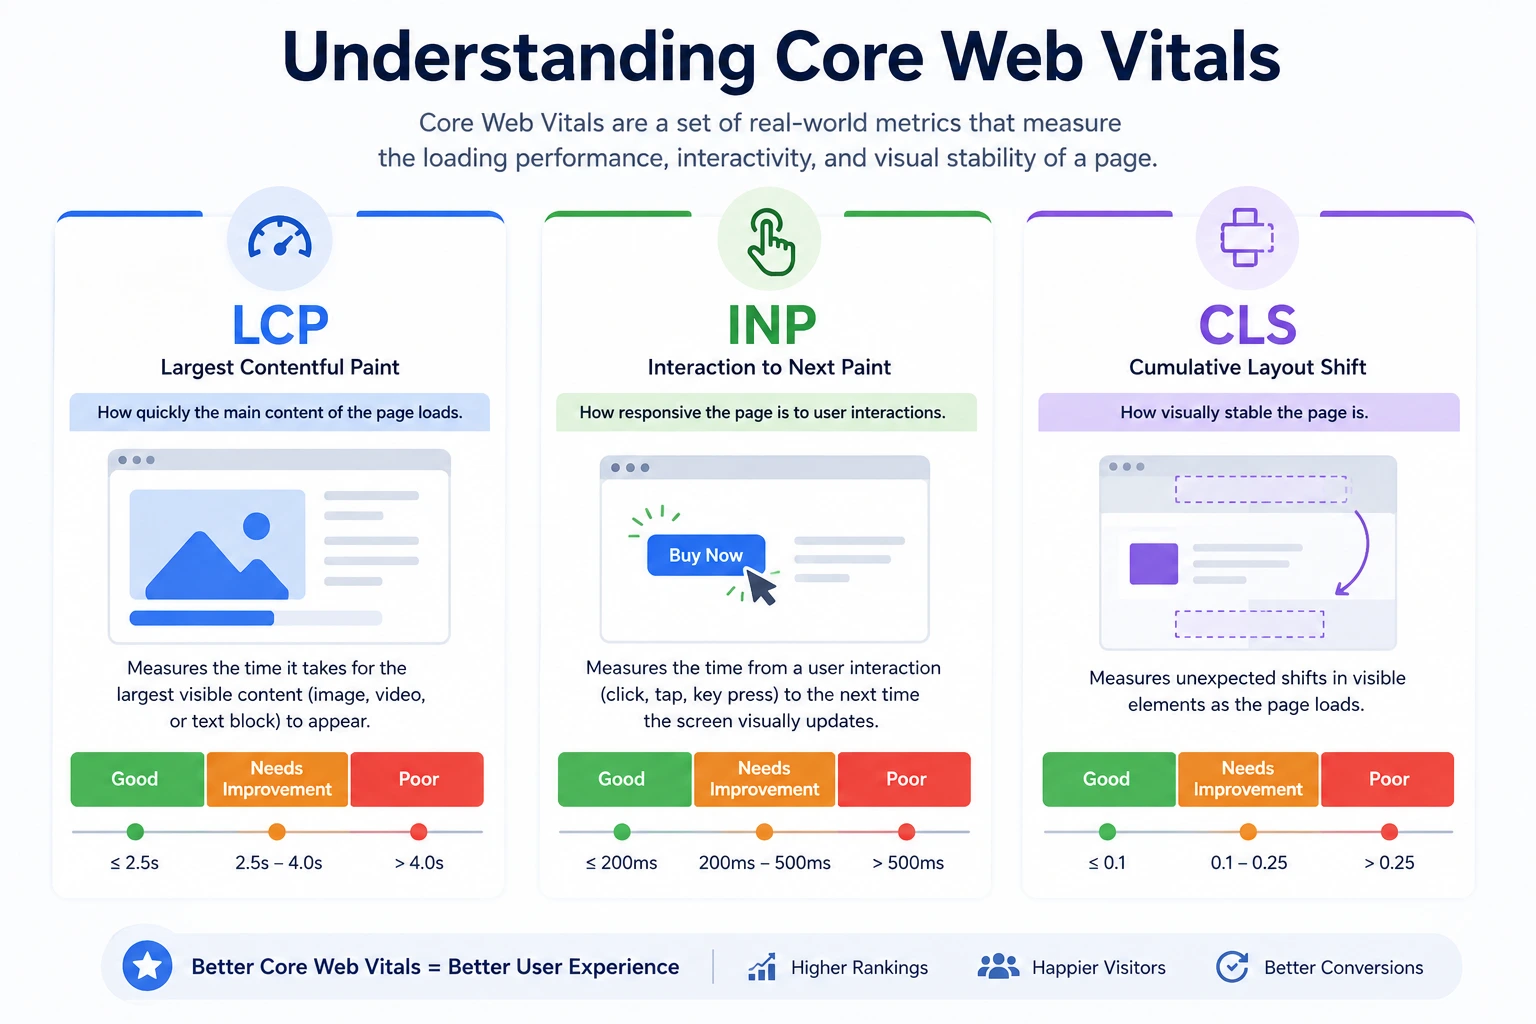
    better Understanding of Core Web Vitals

    Core Web Vitals focus on three major parts of the experience: loading, responsiveness and visual stability. The current metrics are LCP, INP and CLS. Google recommends evaluating them at the 75th percentile rather than relying on one isolated test run.

    LCP, INP and CLS in Plain English

    LCP measures loading. It answers a practical question: when does the main content become visible? (LCP is related to but distinct from First Contentful Paint, which measures when any content first appears.) If your hero image is the largest element in the viewport, that image can become the LCP element. A slow server, poorly prioritized image, render-blocking resources or excessive client-side work can all push LCP later.

    INP measures responsiveness. It is concerned with how quickly the page responds to user interactions. A website can look completely loaded and still have poor responsiveness because JavaScript is consuming too much main-thread time. Google currently considers an INP of 200 milliseconds or less a good result.

    CLS measures visual stability. If content jumps while the visitor is reading or trying to click something, that is a layout shift. Images without reserved dimensions, dynamically inserted banners, advertising elements and some third-party embeds can contribute to the problem. A CLS of 0.1 or less is the current good threshold.

    These metrics describe different problems. A page might have excellent CLS but terrible LCP. Another might load quickly but become unresponsive when several scripts execute. Looking at all three gives you a much better picture of WordPress performance.

    TTFB and the WordPress Server

    Time to First Byte, commonly called TTFB, measures how long it takes before the browser receives the first byte of the response. It is not the entire loading time, but it can establish a slow starting point for everything that happens afterward.

    If your server takes 1.5 seconds to produce the initial response, the browser cannot display the HTML that it has not received yet. You can optimize CSS and compress images afterward, but you have already lost valuable time.

    On WordPress, TTFB can be affected by hosting resources, PHP execution, database queries, uncached requests, plugins, theme logic, external requests and server configuration. Full-page caching can make a dramatic difference for cacheable pages, but caching should not be treated as a substitute for diagnosing the underlying site — see our full breakdown on how to reduce TTFB for the diagnostic steps.
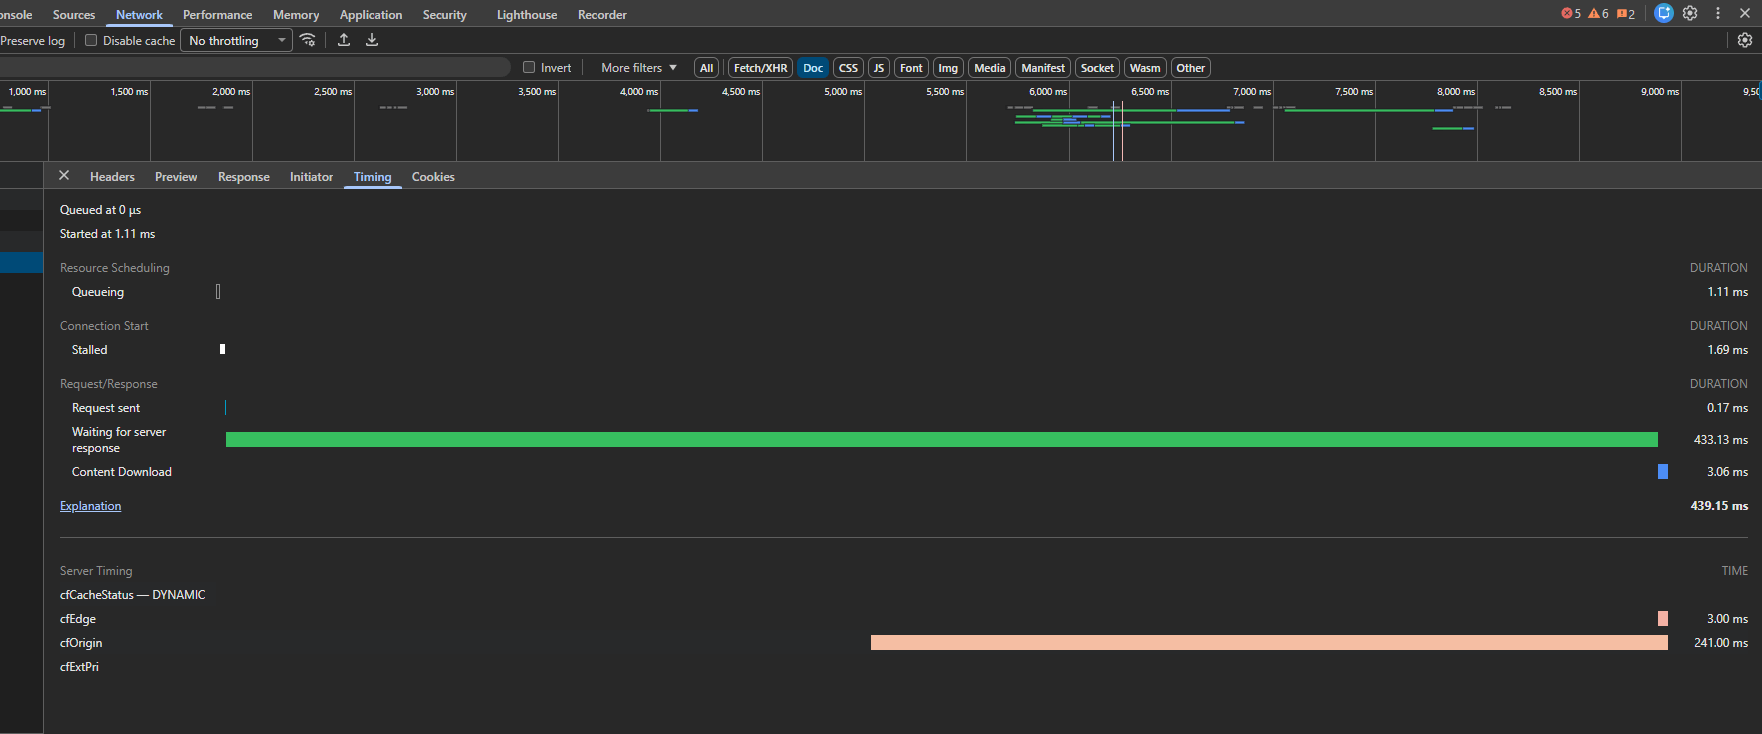
    SCREENSHOT Chrome DevTools Network panel showing document request and TTFB

    When investigating a slow WordPress website, I would not immediately start deleting plugins. First, I want to know whether the delay happens before the HTML arrives or after the browser receives it. That single distinction can save a lot of unnecessary optimization work.

    Render-Blocking CSS and JavaScript

    A browser cannot simply display everything as soon as it receives the HTML. It has to process resources, build the page structure, calculate styles and execute JavaScript.

    Render-blocking CSS can delay the point at which the browser is ready to paint the page. JavaScript can create another problem by occupying the main thread while the browser is trying to render and respond to interactions.

    This is why WordPress optimization plugins often provide options for delaying JavaScript, removing unused CSS or generating critical CSS. Those features can help; we cover the settings that actually move the needle in our guide to reducing total blocking time, but they need to be configured carefully.

    One mistake I see often is enabling every optimization option at once and assuming more optimization must equal better performance. It does not. A script that is delayed incorrectly can break a navigation menu, form, checkout flow or interactive component.

    The better approach is to identify which files are actually contributing to the problem. Look at the waterfall, inspect long tasks and determine what is needed during the initial render. Then make targeted changes and test again.

    Large Images and Hero Sections

    Images are one of the easiest ways to create a misleading performance problem. A homepage may have excellent caching and optimized CSS, yet still feel slow because the most important image is several megabytes or is being delivered at a much larger size than the visitor needs.

    The hero section deserves special attention because it is often above the fold and frequently becomes the LCP element. If that image is requested late, lazy-loaded when it should not be, served at an excessive resolution or blocked behind unnecessary JavaScript, your LCP can suffer.

    WordPress image optimization is not simply about reducing file size. You also need to consider dimensions, format, compression, responsive image delivery, loading priority and whether the image is actually necessary.

    For example, a 2400-pixel-wide image displayed at 700 pixels wide on a phone is doing unnecessary work. The browser has to download more data than the visitor needs.

    Third-Party Scripts Can Change the Experience

    Analytics, advertising, chat widgets, heatmaps, social embeds, tracking platforms and marketing automation tools can all add JavaScript to a page.

    The problem is not that third-party scripts are automatically bad. The problem is that every additional service has a performance cost somewhere. Some scripts download resources, some execute JavaScript, some create network connections and some modify the page after it has already started rendering.

    A website can therefore have a good WordPress setup and still feel slower because of what has been added around it.

    I usually look at third-party requests when a page looks optimized on paper but behaves differently in the browser. If removing or delaying one external script suddenly changes the loading timeline, you have useful evidence about the actual bottleneck.

    The answer is not always “remove the script.” Sometimes it is better to load it later, restrict it to pages where it is needed, or replace it with a lighter implementation.

    Why Mobile and Desktop Scores Differ

    It is normal for mobile PageSpeed performance to be worse than desktop performance. A desktop computer generally has more processing power and a more capable network environment than a typical mobile device.

    Google’s Core Web Vitals thresholds are not different for mobile and desktop, but the practical difficulty of meeting those thresholds can differ because mobile devices and networks are more constrained.

    This is why I would never optimize a WordPress website by looking only at the desktop report.

    A desktop score of 98 can look impressive while the mobile experience remains frustrating. If most of your visitors arrive from phones, the mobile report is much closer to the problem you actually need to solve.
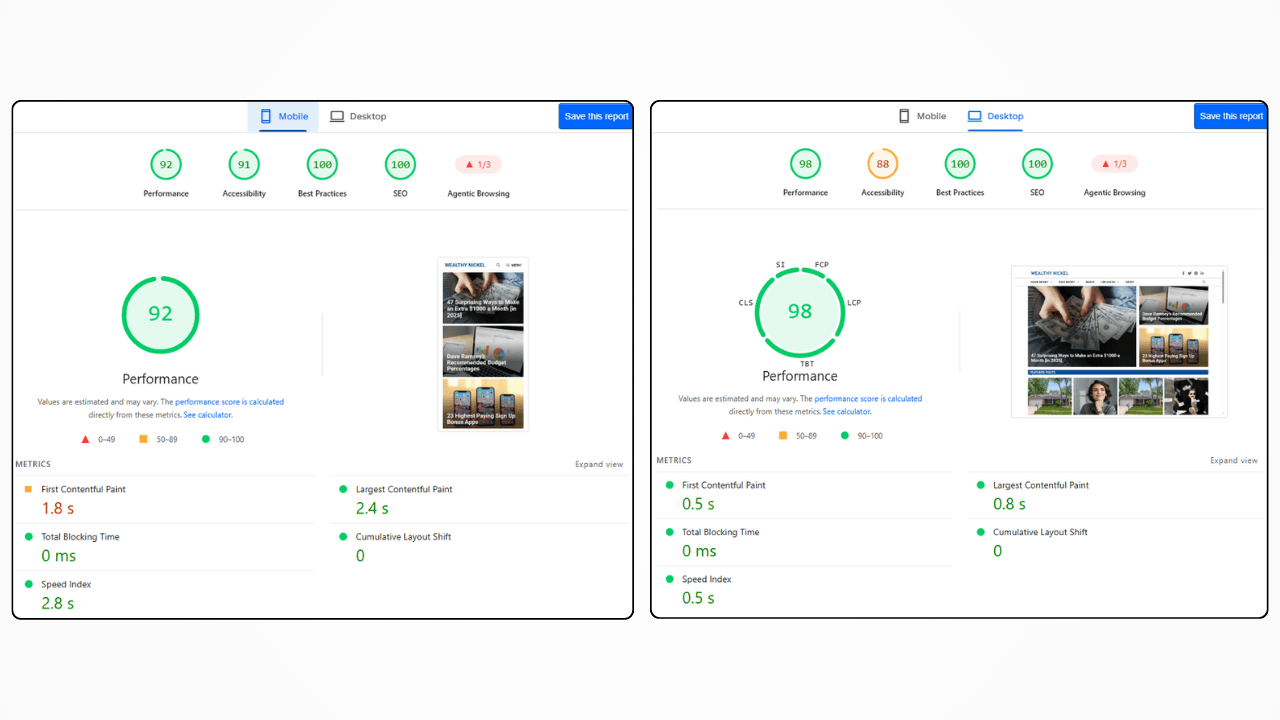
    Desktop versus mobile PageSpeed Insights performance results

    When Should You Actually Worry About Your PageSpeed Score?

    Do not panic because your score is 78, and do not relax simply because it is 94.

    The score becomes useful when it helps you identify a meaningful performance problem. If your real users have poor Core Web Vitals, your pages take too long to become useful, interactions are delayed, or important content appears late, you have a problem even if the score looks respectable.

    Likewise, if your site has a score in the 90s and users are genuinely having a fast experience, spending hours trying to push the number to 100 may provide very little practical value.

    The thresholds are more meaningful than the obsession with the final score. For Core Web Vitals, Google currently identifies good results as LCP up to 2.5 seconds, INP up to 200 milliseconds and CLS up to 0.1.

    What I Check When a WordPress Website Scores Well but Still Feels Slow

    When a site scores well but feels slow, I start by reproducing the problem in an actual browser. I want to see what the visitor sees, not just what the Lighthouse report says.

    Then I look at the Network panel in Chrome DevTools; this is one of several tools we rely on, alongside the others in our WordPress performance audit toolkit. The waterfall can reveal whether the delay comes from the initial HTML request, CSS, JavaScript, fonts, images or third-party resources.

    Next, I inspect the Performance panel. Long JavaScript tasks can explain why a page looks loaded but does not respond immediately.

    I also compare the homepage with other templates. If posts are fast but the homepage is slow, that usually points toward page-specific content, a builder section, hero media, widgets, forms, sliders or scripts that are only loaded there.

    Finally, I compare desktop and mobile behavior and look at real-user data when it is available. The goal is not to collect a bigger score. The goal is to identify the bottleneck that a visitor is actually experiencing.

    A Practical WordPress Speed Diagnosis Process

    A useful performance audit should follow a logical sequence rather than jumping between optimization settings.

    Start with the server response. Check TTFB and determine whether the page is being served from cache. If you’re choosing a caching plugin, our WordPress cache plugin comparison breaks down which one fits your setup. If the server is slow, front-end tweaks may only hide part of the problem.

    Then inspect the rendering path. Find CSS and JavaScript that delay the first useful render. Check whether critical resources are being prioritized correctly and whether unnecessary assets are being loaded on the page.

    After that, inspect images and fonts. Look specifically at the LCP element instead of compressing every image on the site without understanding which ones matter.

    Next, review third-party scripts. Identify external domains, tracking scripts, chat tools, advertising systems and embedded services. Ask whether each one needs to load immediately.

    Finally, test the page after every meaningful change. Performance optimization is much easier when you know which change produced which result.

    This process is particularly important on WordPress because a plugin may not be the problem by itself. A plugin can be perfectly reasonable while its assets are being loaded on pages where they are unnecessary. The solution might be asset management rather than uninstalling the plugin.

    Stop Chasing 100 and Start Measuring the Right Things

    A perfect PageSpeed score is satisfying. It is also easy to chase because the number gives you an obvious target.

    The problem starts when optimization decisions are made solely to improve that number. You can spend hours removing a few milliseconds from a lab test while ignoring a slow server, a massive hero image or a JavaScript-heavy third-party tool that visitors actually notice.

    Instead, track Core Web Vitals, TTFB, LCP, responsiveness, visual stability and actual loading behavior. Compare those measurements across important templates and devices.

    A useful performance target is not “make PageSpeed say 100.” A better target is “make the important pages consistently fast for real visitors.”

    That difference sounds small, but it changes the entire optimization process.

    Conclusion

    A 90+ PageSpeed score is a good signal, but it is not proof that a WordPress website is fast. PageSpeed Insights is a diagnostic tool, and its lab environment cannot represent every device, connection and interaction experienced by your visitors.

    The better approach is to look at the entire loading process. Check TTFB, identify the LCP element, understand JavaScript execution, inspect images, review third-party requests and compare mobile with desktop. When real-user Core Web Vitals data is available, use it because it tells you what visitors are actually experiencing.

    At ProSpeedGuy, the useful part of a performance audit is not producing a pretty score. It is finding the reason a page is slow and fixing the bottleneck that matters. If a WordPress site scores well but still feels slow, a technical performance audit can be more valuable than another round of blindly changing PageSpeed settings.

    FAQs

    Is a 90 PageSpeed score good?

    Yes, a 90 or higher is generally a strong Lighthouse performance score, but it does not guarantee that every visitor experiences a fast website. Check Core Web Vitals, TTFB and actual browser behavior alongside the score.

    Why is my WordPress website slow when PageSpeed says 90+?

    The issue may come from server response time, a slow LCP element, JavaScript execution, third-party scripts, large images or differences between the test environment and your real visitors. A high score does not eliminate these possibilities.

    What is a good LCP for WordPress?

    Google currently recommends an LCP of 2.5 seconds or less at the 75th percentile for a good user experience.

    Is TTFB important for WordPress speed?

    Yes. TTFB affects how quickly the browser receives the initial response. Slow hosting, uncached pages, PHP processing, database work and server configuration can all contribute to a high TTFB.

    Should I try to get a PageSpeed score of 100?

    Not necessarily. Once a website is performing well, chasing the last few points can become counterproductive. Focus on user-facing metrics and bottlenecks that affect real visitors.

    Why is my mobile PageSpeed score much lower than desktop?

    Mobile devices generally have less processing power and may use slower or less reliable networks. This can make JavaScript execution, image delivery and rendering more difficult, so desktop and mobile results can differ significantly.

    How can I find what is actually making my WordPress site slow?

    Start with PageSpeed Insights, then reproduce the issue in Chrome DevTools. Check the Network waterfall for server and resource delays, inspect the Performance panel for long tasks, identify the LCP element and review third-party scripts. Combining these tools gives you much more information than the score alone.
  • DIY: 12 Practical Core Web Vitals Fixes That Actually Work

    DIY: 12 Practical Core Web Vitals Fixes That Actually Work

    If your site feels fast on desktop but still fails performance checks, a Core Web Vitals fix guide is exactly what you need. In 2026, speed is no longer just a technical nice-to-have; it affects user experience, conversions, and how confidently your site can compete in search.

    The good news is that most Core Web Vitals problems are fixable. The bad news is that many sites try to fix the wrong things first, like buying a new plugin before checking hosting, images, scripts, or theme bloat. This guide focuses on practical fixes you can actually apply, especially if you run a WordPress site.

    What Core Web Vitals Mean

    fix LCP WordPress
fix INP WordPress
fix CLS WordPress
core web vitals WordPress 2026
improve core web vitals
core web vitals optimization
PageSpeed Insights fix

    Core Web Vitals are Google’s key page experience metrics. They focus on three things: how fast the main content loads, how stable the page looks while loading, and how quickly users can interact with it.

    The three metrics are:

    • LCP: Largest Contentful Paint
    • CLS: Cumulative Layout Shift
    • INP: Interaction to Next Paint

    In simple terms, LCP measures loading speed, CLS measures visual stability, and INP measures responsiveness. If one of these is bad, your site may feel slow or frustrating even if the design looks good.

    How To Check Your Scores

    Before fixing anything, test your site so you know what is actually broken. Use PageSpeed Insights, Lighthouse, and Search Console to see both lab data and real-world field data.

    Focus on templates, not just the homepage. A blog post, product page, and landing page can all perform differently, and the weakest template often drags down the whole site.

    Fix LCP First

    LCP is usually the metric that needs the most attention. If your main content takes too long to appear, users feel the site is slow even if everything else eventually loads.

    Start with the biggest causes:

    • Slow hosting
    • Heavy hero images
    • Render-blocking CSS and JavaScript
    • Too many fonts or third-party scripts

    A few strong fixes usually make a big difference:

    • Compress and resize your main image.
    • Use WebP or AVIF where possible.
    • Preload the hero image and critical fonts.
    • Remove unused scripts from the header.
    • Use caching and a CDN.

    Fix CLS Next

    CLS is all about page stability. If things jump around while the page loads, the experience feels sloppy and can hurt trust.

    The most common causes are missing image dimensions, ads that inject late, and font swapping. To reduce layout shift, always define image and video sizes, reserve space for embeds and ads, and use font loading settings that prevent text from jumping.

    Fix INP For Better Interaction

    INP became more important after Google replaced FID, and it measures how quickly the page responds when users click or tap. If your site feels laggy after someone interacts with it, this is the metric to watch.

    The biggest causes are heavy JavaScript and too many third-party tools. To improve INP, reduce script weight, delay non-essential tools, break long tasks into smaller chunks, and remove anything that blocks the main thread.

    Best WordPress Fixes

    If you use WordPress, the fastest wins usually come from simplifying the stack. A lightweight theme, fewer plugins, and better hosting often do more than endless tweaking.

    The most useful WordPress-specific fixes are:

    • Switch to a lightweight theme.
    • Use a performance-focused caching plugin.
    • Optimize images before upload.
    • Remove unused builders, sliders, and add-ons.
    • Limit chat widgets, trackers, and other third-party scripts.

    Common Mistakes To Avoid

    A lot of sites waste time fixing the wrong layer first. For example, changing fonts will not help much if your hosting is slow or your homepage loads too many scripts.

    Avoid these mistakes:

    • Optimizing only the homepage.
    • Ignoring mobile results.
    • Keeping unnecessary plugins active.
    • Adding more scripts while trying to improve speed.
    • Measuring once and never checking again.

    Simple Fix Order

    If you want the fastest path to better scores, follow this order:

    1. Improve hosting response time.
    2. Optimize the LCP image.
    3. Remove render-blocking CSS and scripts.
    4. Set image and video dimensions.
    5. Reduce JavaScript and third-party code.
    6. Re-test after each change.

    This order works because it tackles the biggest bottlenecks first. Small improvements add up quickly when the page is already bloated.

    FAQs

    What is the easiest Core Web Vitals fix?

    The easiest fixes are usually image compression, resizing images correctly, and removing unnecessary scripts. These changes often improve scores without touching code.

    Which Core Web Vital matters most?

    All three matter, but LCP is often the most noticeable because it affects how fast the main content appears. If the page looks slow, users usually notice that first.

    Do Core Web Vitals affect SEO?

    Yes, they can affect SEO because they are part of page experience and influence how users interact with your site. Better performance also usually leads to better engagement.

    Can a WordPress theme affect Core Web Vitals?

    Yes. Heavy themes can add extra CSS, JavaScript, and layout complexity that slow pages down. Best WordPress themes usually give you a better starting point.

    How often should I test my site?

    Test whenever you make major changes, and also on a regular schedule. Performance can degrade over time as plugins, media, and third-party tools are added.

    Conclusion

    Fixing Core Web Vitals is mostly about reducing friction. If you improve hosting, simplify the page, optimize images, and cut unnecessary scripts, your site will usually become faster and more stable without a complete redesign.

    The best approach is to fix LCP, CLS, and INP in that order, then keep testing so performance does not slowly slide back. For WordPress sites, a lightweight theme, optimized hosting, and fewer plugins are still the foundation of better results.

    In the end if there’s no improvement in your stats? get me here for Core Web Vitals fixes 🙂

  • 12 Ways To Reduce Total Blocking Time In WordPress -PSI

    12 Ways To Reduce Total Blocking Time In WordPress -PSI

    Need to reduce your total blocking time in WordPress?

    Total blocking time is caused by long tasks (over 50ms) that block the main thread.

    For WordPress sites, total blocking time is usually caused by unoptimized JavaScript and CSS (often from plugins, page builders, or third-party code) as well as fonts, animations, and images.

    Optimizing JavaScript is a good place to start which you can use defer, delay, and asset unloading plugins to do. But if you want to improve TBT at the source, take a look at your JavaScript files and learn which elements on your site are causing high total blocking time.

    1. Find Elements Causing High Blocking Time

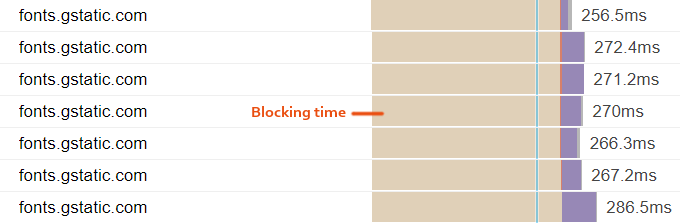
    GTmetrix Waterfall – brown bars represent blocking time.

    Blocking Time - GTmetrix Waterfall

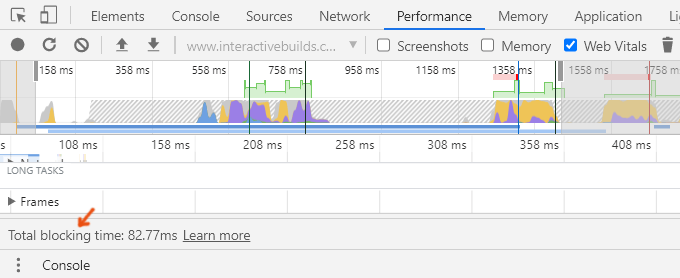
    Chrome Dev Tools – the Performance tab in Chrome Dev Tools shows total blocking time.

    Total Blocking Time - Chrome Dev Tools

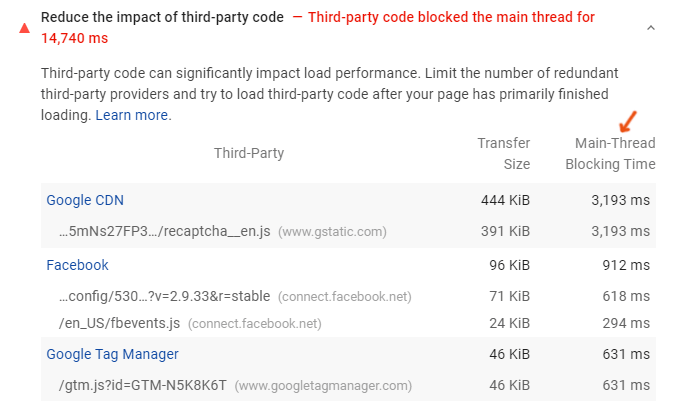
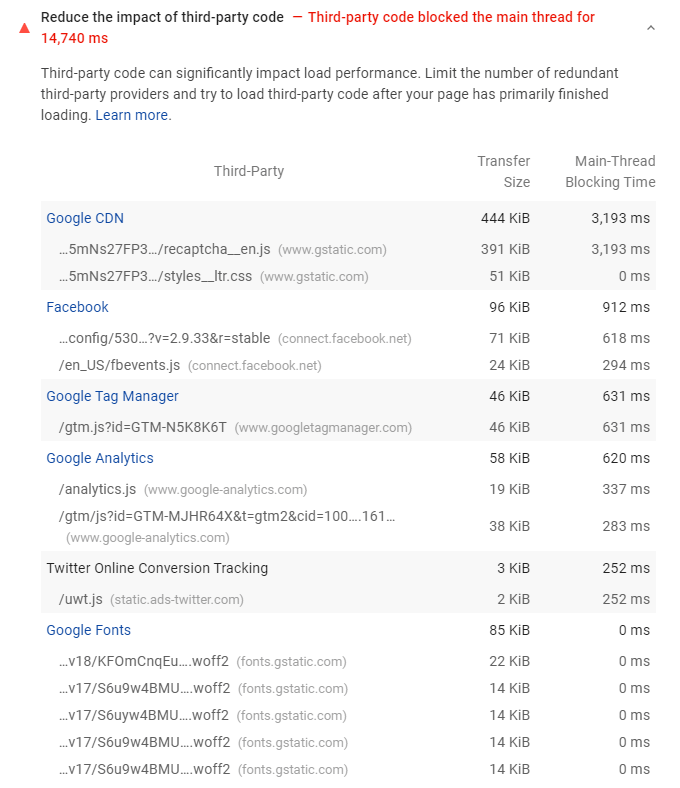
    Third-Party Code – blocking time of third-party code can be directly measured in PageSpeed Insights. Often, this is from Google Fonts, Analytics, Tag Manager, advertisements, and videos.

    Main-Thread Blocking Time

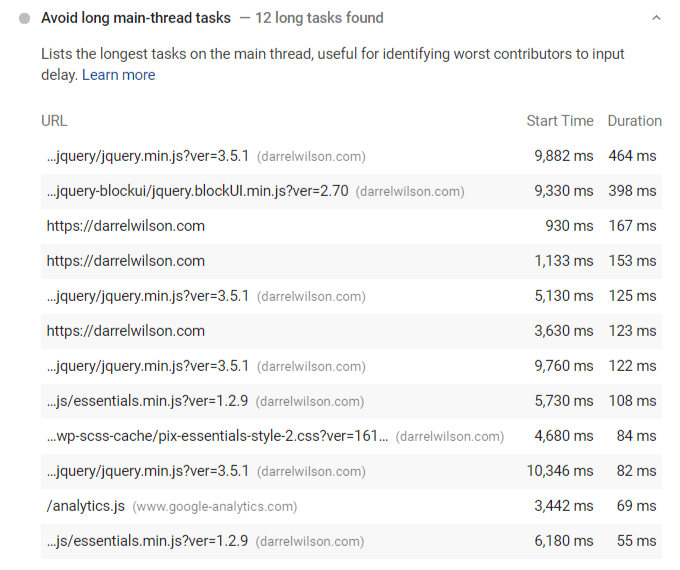
    Long Main-Thread Tasks – Google lists “minimize main-thread work” as one of the biggest factors of total blocking time. Find your worst main-thread contributors in PageSpeed Insights.

    Avoid long main-thread tasks WordPress

    What Is A Good Total Blocking Time?

    0–300Fast
    300-600Average
    Over 600Slow

    2. Defer JavaScript

    Deferring JavaScript improves total blocking time by eliminating render-blocking resources.

    WP Rocket and other cache plugins might let you “load JavaScript deferred” but Autoptimize and Async JavaScript do a better job (they fixed all but one render-blocking resource for me).

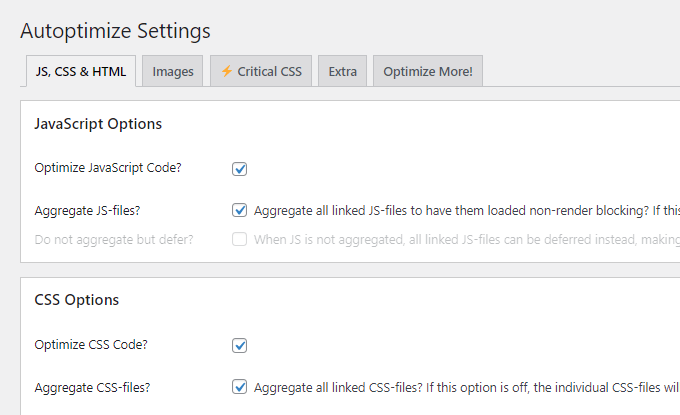
    Install Autoptimize and enable optimize (and aggregate) CSS and JavaScript code.

    Optimize Aggregate JavaScript CSS

    Next, install the Async JavaScript plugin, head to the settings, and click “apply defer.”

    Async JavaScript Apply Defer

    This should disable “minify CSS and JavaScript” in your cache plugin and let Autoptimize handle it. Retest your website for render-blocking resources and ideally, your scores will be improved.

    3. Delay JavaScript

    Delaying JavaScript can also improve total blocking time.

    This is usually done using the Flying Scripts plugin or WP Rocket’s delay JavaScript execution setting. It will delay JavaScript until user interaction which makes your initial load time faster.

    If you’re using Flying Scripts or another method, you can copy WP Rocket’s list of scripts that are delayed and use that as a baseline. You may also consider delaying //cdnjs.cloudflare.com and other non-critical JavaScript in your PageSpeed Insights and GTmetrix Waterfall report.

    Delay JavaScript Execution

    4. Test Combining CSS And JavaScript

    Combining CSS and JavaScript can increase or decrease total block time.

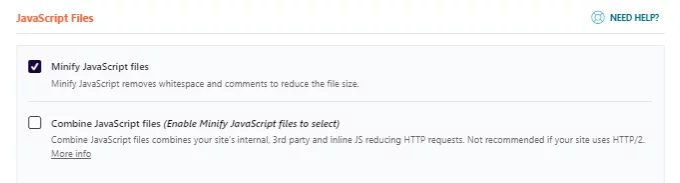
    Try enabling and disabling this (usually in your cache plugin) and test the results of both. WP Johnny says that smaller websites should usually combine while larger sites usually shouldn’t.

    Don't Combine JavaScript

    5. Remove Unused JavaScript

    Removing unused JavaScript can significantly lower total blocking time.

    Choose An Asset Unloading Plugin

    Asset CleanUp and Perfmatters are popular plugins for unloading assets. I use Perfmatters on my WordPress site since the UI/UX is much better. However, Asset CleanUp is free and the Pro Version lets you unload custom CSS while Perfmatters (and Asset CleanUp free version) do not.

    Enable The Test Mode And Script Manager

    If using Asset CleanUp, enable test mode so you can test unloading assets without breaking your site. If using Perfmatters, enable the script manager in the settings. Perfmatters doesn’t have a test mode, so create a staging site or check your site for errors after unloading assets.

    Remove Unused JavaScript Where It’s Not Being Used

    Edit a page or post and view all scripts (and styles) loading on the page. If a script or style is being loaded when it’s not being used on the page, you can disable it. You can disable it on the current URL, use regex, or disable it everywhere but current URL, pages, or posts. You will need to do this for multiple pages/posts on your site where different assets/plugins are being loaded.

    Disable-Elementor-Scripts

    Examples:

    • Disable unused CSS/JS in Elementor and other page builders.
    • Disable social sharing plugin everywhere but posts.
    • Disable slider/lightbox plugins except content where they’re used.
    • Disable WooCommerce scripts and styles on non-eCommerce content.

    6. Minify CSS And Generate Critical CSS

    Most cache plugins have an option to minify CSS, minify JavaScript, and use critical CSS (optimize CSS delivery in WP Rocket). All can help improve total blocking time in WordPress.

    However, both can result in errors.

    Minification errors are easy to fix (find the problematic files in your source code and exclude them from minification).

    Optimize CSS delivery errors may require a few extra steps:

    • Search “rocket-critical-css” in your source code to make sure it’s working.
    • If it doesn’t appear, regenerate critical CSS in WP Rocket and page builders (if applicable).
    • Run your site through PurifyCSS.
    • Download the combined, purified, and minified CSS.
    • Paste the CSS code in the “fallback critical CSS” field.
    • Exclude files from CSS delivery using WP Rocket’s helper plugin.
    • Disable optimize CSS delivery on individual pages/posts if needed.
    • If neither of these work, you can try Gijo Varghese’s FlyingPress plugin.
    WP Rocket fallback critical CSS

    7. Optimize Third-Party Scripts

    Reducing impact of third-party code is the first thing Google recommends to improve total blocking time.

    Open this report in PageSpeed Insights to see which third-party code is blocking the main thread as well as its blocking time. Third-party code is anything that loads from external websites (Google Analytics, Tag Manager, advertisements, social networks, Hotjar, others).

    Reduce Impact Of Third-Party Code WordPress

    Once you know which scripts cause high blocking times, optimize them:

    • Delay JavaScript from third-party scripts.
    • Host Gravatars locally using WP User Avatar.
    • Reserve space for ads and delay the JavaScript.
    • Host Google Fonts and Google Analytics locally.
    • Use a lightweight social sharing plugin like Grow Social.
    • Lazy load videos and replace iframes with a preview image.
    • Host Facebook Pixel locally in WP Rocket’s add-on settings.
    • Prefetch third-party domains (here’s a list of common domains).
    • Take a screenshot of a Google Map and link the image to driving directions.

    8. Host Fonts Locally And Preload Them

    Fonts can increase total blocking time and it’s always faster to host them locally.

    Host Fonts Locally – download your fonts directly from the Google Fonts website (while being minimal with families/weights), convert them to WOFF2 format using a tool like Transfonter, and add them to your CSS. Alternatively, you can also use the OMGF plugin to host fonts locally.

    Preload Fonts – preloading fonts can be done manually or using WP Rocket and Perfmatters. Google may recommend preloading some fonts in your preload key requests report, or you can find your font files in the GTmetrix Waterfall “Fonts” section. Copy the URLs and preload them.

    Preload Fonts- preload key requests report

    9. Fix 4xx And 5xx Errors In GTmetrix Waterfall

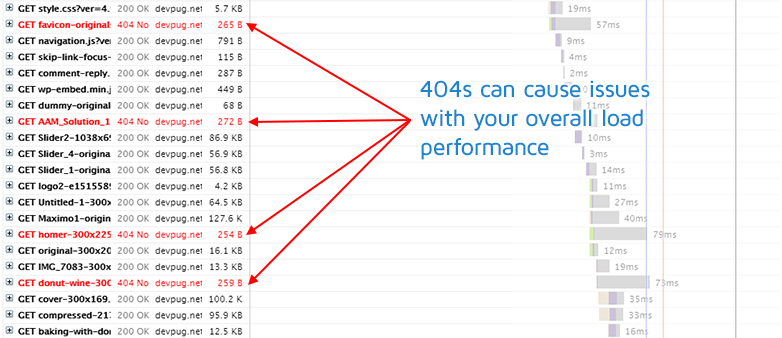
    If you have red errors in your GTmetrix Waterfall chart, it means there’s an error loading the request. As you can see, it adds quite a bit of blocking time and wait time. Fix this immediately!

    404 GTmetrix Canceled Errors

    10. Remove Heavy Plugins And Page Builders

    Some page builders add lots of extra CSS and JavaScript to your site.

    Elementor and Divi were two of the slowest page builders in speed tests. In Facebook Groups, there is also a large trend of people moving to Gutenberg, Oxygen Builder, and GeneratePress.

    If you don’t want to remove your page builder, you can still do the following:

    • Disable unused Elementor features using Asset CleanUp or Perfmatters (step #5).
    • Test your speed when adding extra plugins for page builders (Ultimate Addons, etc).
    • If you’re using additional plugins for page builders, disable modules you’re not using.
    • Enable Optimized DOM Output and Improved Asset Loading in Elementor settings.
    • Hard code your header, menu, footer, and blog sidebar so it doesn’t use page builders.
    • Avoid running heavy page builders on top of cheap, shared hosting with low CPU limits.

    11. Test Total Blocking Time Without Animations

    Animations can look nice, but they’re definitely not good for speed.

    They can increase both total blocking time and cumulative layout shift. Google recommends using the CSS transform property which lets you use animations without causing layout shifts. Otherwise, you may want to try removing animations and retesting your total blocking time.

    Cumulative Shift Layout WordPress Animations

    12. Optimize Images

    Optimizing images improves total blocking time by keeping request counts low and transfer sizes small. There are multiple recommendations in PageSpeed Insights for optimizing images.

    • Compress images – ShortPixel is a solid image optimization plugin. PageSpeed Insights uses an 85% compression level in their tests – so that’s what I recommend setting it at.
    • Properly size images – avoid huge images and resize them to correct dimensions. For example, my blog width is 680 pixels (with) so I crop my blog images to those dimensions.
    • Serve images from a CDN – serve images (and other assets) from your CDN URL. Often, this isn’t enabled when setting CDNs and you’ll need a CDN rewrite (e.g. in Perfmatters).
    • Specify image dimensions – add a width and height attribute to the image’s HTML. Same thing as WP Rocket’s settings for “add missing image dimensions” which does it for you.
    • Serve important images in WebP format – next-gen format images and faster than JPEG/PNG. I would at least convert your critical images (logo, sidebar images, etc). ShortPixel and WebP Media Converter are top choices for converting images to WebP.
    • Use adaptive images – use an adaptive images plugin to serve smaller images on mobile.

    Retest Your Total Blocking Time

    Once you’re ready, run your WordPress site through Lighthouse, PageSpeed Insights, or GTmetrix and check your total blocking time. Hopefully, it’s under 300ms like Google wants.

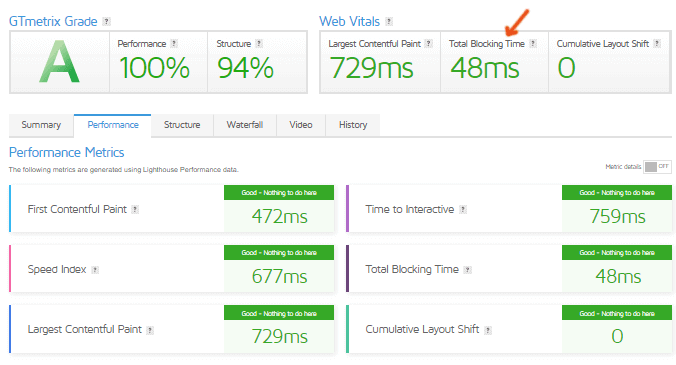
    prospeedguy.com -Total Blocking Time WordPress - GTmetrix Report

    Frequently Asked Questions

    How do I reduce total blocking time in WordPress?

    The most effective way to reduce total blocking time in WordPress is to optimize JavaScript files (including third-party code). Defer, delay, minify, and remove unused JavaScript to cut down on your blocking times.

    How do I reduce total blocking time using WP Rocket?

    To reduce blocking time using WP Rocket, delay non-critical JavaScript, load JavaScript deferred, and make sure optimized CSS delivery is working properly. Minifying CSS, JavaScript, and preloading fonts can also reduce blocking time.

    How do I reduce total blocking time on mobile?

    Check files with long main-thread blocking times in your mobile speed report and optimize those specifically. Avoid hamburger menus and complex designs on mobile. Remove sliders and heavy plugins from mobile that aren’t absolutely needed. Keep it simple.

    How can I improve total blocking time in Elementor?

    Elementor adds a lot of CSS and JavaScript which can increase total block times. Try disabling Elementor assets using an asset unloading plugin. Avoid animations if possible and enable optimized DOM output and improved asset loading in your Elementor settings.

    Hope this was helpful!

    Cheers,
    Hafiz

  • Low Score In Google PageSpeed Insights Or Lighthouse Mobile Test?

    Low Score In Google PageSpeed Insights Or Lighthouse Mobile Test?

    We get emails every day from website owners, telling us their site is fast but slow on mobile. Nine time out of ten they’ve tested their site on Google PageSpeed Insights (PSI) and the mobile score is low.

    Long story short, a low PageSpeed Score in mobile does not mean your site is slow on a mobile device. Pagespeed Insights is not a real speed test – it’s a technical checklist test. There are some important things to understand and keep in mind when it comes to the Mobile Pagespeed Score we’ve explained below.

    If you’re into tech stuff, there’s a great discussion on Github here about the credibility of Lighthouse/PSI mobile score.

    1. They’re testing your site on a speed limited, CPU limited connection

    Mobile PageSpeed simulates at 1.6mb/second connection – that is REALLY slow in modern internet speed terms. A moderately sized page of say 1.5-2mb is going to score low on this test simply because of the amount of time that data takes to download.

    The CPU limiting they do also causes sites that have even moderate amounts of javascript to be marked down heavily. The modern web runs on javascript and many WordPress themes require a javascript library called Jquery in order to render which means they automatically score lower.

    They of course don’t tell you this anywhere on the report itself, it’s hidden deep in the technical documents.

    2. Pagespeed Insights Isn’t a Speed Test, It’s a Technical Checklist

    Pagespeed Insights is more concerned with measuring your site against a technical checklist that correlates with speed rather than the raw speed of the site itself.

    The latest version of Pagespeed Insights does take into account some speed elements but it’s still largely concerned with checking boxes.

    3. Geography & Location Is Ignored

    PSI completely ignores geography and doesn’t take into account where your visitors are located and where your hosting is. This means its speed test is not necessarily true to the real world. If your hosting is in Australia and your customers are in Australia but the speed test elements of PSI are performed from the US then it’s not a true-to-life test.

    4. Website Speed Is Not Just Your Homepage

    This is something 99.9% of webmasters running speed tests completely miss – website speed is not just your homepage. Every page on your site is important when it comes to speed and testing the homepage is useful but is a bit of a 1-dimensional approach, you should probably be looking at all pages.

    5. High PageSpeed Score Will Likely Not Improve Your SEO

    There’s a misconception that a high PageSpeed Score means that the Google Gods will gift magical SEO rankings. This is not the case – for starters, see the previous point.

    Second, to that, achieving a 100 score especially on a WordPress site is extremely difficult unless you break the render of the site OR switch to a theme that does not use jquery – this article talks through the Fastest WordPress Themes in more detail.

    We’ve seen SEO consultants and webmasters spend days obsessing over Pagespeed score in the hope it will boost SEO. Your time would be better spent on other SEO tasks like optimizing your meta descriptions for CTR or optimizing your open graph tags to boost social CTR.

    6. The Score Varies Wildly From Test to Test

    Run multiple tests and you’ll see the score varies wildly often by 20-30 points. That’s partly a function of geography but these inconsistencies make it difficult to trust the tool.

    That’s all folks!

    Really hope this helped! If it did, drop me your new scores + load times via email 🙂

    Cheers,
    Hafiz

  • How to avoid network payloads In WordPress

    How to avoid network payloads In WordPress

    Let’s talk about enormous network payloads in PageSpeed Insights.

    This is triggered when the total page size is above 1,600 KiB. To pass this test, you need to reduce page size.

    Large page size is often caused by unoptimized images, videos, third-party code, or heavy CSS and JavaScript files. It can also be from slow page builders (specifically Elementor and Divi) which add extra CSS, JavaScript, and div wrappers to every single page on your WordPress site.

    PageSpeed Insights shows your largest files which is where you should be focusing your attention. Once you know these, reference the solutions in this guide (which are specific to WordPress sites) and you should be able to pass the avoid enormous network payloads test.

    1. Identify The Cause Of Enormous Network Payloads

    Use PageSpeed Insights to identify files causing enormous network payloads.

    Pay attention to the file type (image, CSS, JS) and where the file is being served from (your domain, CDN, a third-party service).

    Just by glimpsing at your report, you will know which files need to be optimized so you can narrow down the solution.

    Avoid Enormous Network Payloads WordPress

    2. Avoid Enormous Images

    Huge images can cause enormous network payloads.

    These appear in the properly size images recommendation.

    Properly Size Images

    This simply means you need to resize images to smaller dimensions. I created a “cheat sheet” with image dimensions for my logo, blog, sidebar, and inner pages. That way, I know the exact dimensions images should be resized to before uploading them. Some image optimization plugins have resizing options, but it’s best to upload them with correct dimensions beforehand.

    Adaptive image plugins can serve smaller images to mobile devices and improve mobile speed.

    3. Compress Images

    This is also known as efficiently encoding images.

    efficiently encode images

    Lighthouse sets the compression level to 85% and flags images that would have a savings of 4KiB or higher.

    ShortPixel and TinyPNG are popular options, or you can do this in Photoshop or GIMP. Try setting the compression level to 85% and you shouldn’t have errors for this item anymore.

    4. Consider WebP

    WebP images typically have a 25-34% smaller file size than JPEGs and PNGs (and are also higher quality).

    You can convert images to WebP using ShortPixel, Imagify, and many other image optimization plugins for WordPress. If your plugin doesn’t support it, you can also use WebP Converter For Media. When selecting the conversion method, <picture> tag is usually the preferred method.

    Serve Images In next-gen formats wordpress

    However, many speed-related sites like Kinsta and WP Rocket use SVGs for their high quality images (logo, background image, etc). SVGs don’t get flagged in Lighthouse and still produce high quality images similar to WebP. You may need to use an SVG support plugin to avoid errors.

    5. Minify CSS + JavaScript

    Most cache plugins have settings to minify CSS and JavaScript which removes unnecessary characters from your code (reducing the file size).

    If enabling this gives you errors, you’ll need to find the problematic file(s) in your source code and exclude them from minification. Otherwise, make sure you’re minifying CSS and JavaScript.

    6. Remove Slow Page Builders

    Elementor and Divi add unnecessary CSS and JavaScript.

    I was previously using Elementor and hired WP Johnny for his page builder removal services and it made a huge difference. Just by hard coding my header, footer, menu, and sidebar, my entire web vitals score shot up. Then he migrated my Elementor pages to Gutenberg which made an even bigger difference. I was averaging C scores and after doing this, I’m averaging A’s.

    In Facebook Groups, there is a large trend of people migrating away from Elementor/Divi. Popular alternatives are Gutenberg, Oxygen, and GeneratePress.

    Page Builder Speed
    Source: Oxygen4Fun

    7. Remove Unused CSS + JavaScript

    Asset CleanUp and Perfmatters can trim the size of CSS and JavaScript.

    They essentially provide you with a script manager to disable CSS/JS on pages where they don’t need to load. So if your contact form loads across your entire site, only load it on the contact page. Plugins for social sharing, sliders, rich snippets, live chat, and others can often be disabled on certain content. Perfmatters vs. Asset CleanUp, but I use Perfmatters since the UI/UX is better. However, Asset CleanUp Pro can disable custom CSS.

    As mentioned previously, Elementor and Divi can add lots of CSS and JavaScript to your site. Some files might be able to be disabled such as elementor-sticky, dialog, share-link, swiper, animations, icons, and wp-block-library if you don’t use these features. Elementor also released Optimized Dom Output and Improved Asset Loading which can help reduce network payloads.

    Disable-Elementor-Scripts

    8. Optimize Google Fonts

    Use the GTmetrix Waterfall chart to see how long your fonts take to load. They can slow especially if you’re loading multiple font families, weights, and they’re not hosted locally.

    GTmetrix Font Files

    Make your fonts load faster:

    • Host fonts locally using OMGF or Transfonter.
    • Be very minimal with font families, weights, icons.
    • Use browser resource hints (preload, preconnect, prefetch).
    • Avoid font plugins and serving fonts from any type of plugin.
    • Add font-display: swap to ensure text remains visible during webfont load.

    9. Optimize Third-Party Code

    When trying to avoid enormous network payloads, you may notice files are being loaded from a third-party site.

    These can flag additional PageSpeed Insights items such as reducing third-party code. Below are common examples of third-party code and common solutions to optimize them. Some items are easy to optimize (hosting fonts and analytics locally) while others (AdSense and GTM) are not.

    • Google Fonts – host locally instead of serving them from //fonts.gstatic.com. Also take advantage of browser resource hints (preload, preconnect, prefetch).
    • Google Maps – take a screenshot of the map and link it to driving directions.
    • Google Analytics – host locally using WP Rocket or Flying Analytics. If using Perfmatters, use a smaller tracking code (minimal, minimal inline, or analytics.js) and disable display features to prevent a second HTTP request to Doubleclick.
    • Google AdSense – lazy load and delay JavaScript in WP Rocket or Flying Scripts.
    • Google Tag Manager – delay in WP Rocket or Flying Scripts and clean up tags.
    • Facebook Pixel – hosting it locally using WP Rocket is the only way I know of.
    • YouTube – lazy load, replace iframes with preview images, and delay JavaScript.
    • Social Media – use Grow by Mediavine which was the fastest social sharing plugin in WP Rocket’s test, avoid social media widgets (e.g. Facebook Like boxes).
    • Gravatars – delay Gravatars and use a local Gravatar image with WP User Avatar (my blog comments show an example of a custom Gravatar image I use).
    • WPdiscuz – tweak the settings to initiate AJAX loading after page, disable WordPress native AJAX functions, and disable load font awesome CSS lib. After delaying comments and using WP User Avatar, your comments should load very quickly. Native WordPress comments fast too (I just like the look of WPdiscuz).

    10. Delay JavaScript

    Delaying JavaScript can be done in WP Rocket (delay JavaScript execution) or Flying Scripts.

    Each plugin works a little differently. WP Rocket delays JavaScript until user interaction (e.g. mouse scroll, click). Flying Script sets a timeout period in seconds until the JavaScript is loaded.

    This won’t help avoid enormous network payloads since you’re just delaying JavaScript (not optimizing it) but it can improve your site’s initial load time and potentially, your web vital scores. This is especially true if you delay AdSense, comments, and heavy third-party code.

    Below is the default list of JavaScript WP Rocket delays. If you have other non-critical JavaScript that can be delayed (check your GTmetrix Waterfall report), try delaying that too.

    getbutton.io
    /app/js/api.min.js
    feedbackcompany.com/includes/widgets/feedback-company-widget.min.js
    snap.licdn.com/li.lms-analytics/insight.min.js
    static.ads-twitter.com/uwt.js
    platform.twitter.com/widgets.js
    twq(
    /sdk.js
    static.leadpages.net/leadbars/current/embed.js
    translate.google.com/translate_a/element.js
    widget.manychat.com
    google.com/recaptcha/api.js
    xfbml.customerchat.js
    static.hotjar.com/c/hotjar-
    smartsuppchat.com/loader.js
    grecaptcha.execute
    Tawk_API
    shareaholic
    sharethis
    simple-share-buttons-adder
    addtoany
    font-awesome
    wpdiscuz
    cookie-law-info
    pinit.js
    /gtag/js
    gtag(
    /gtm.js
    /gtm-
    fbevents.js
    fbq(
    google-analytics.com/analytics.js
    ga( ‘
    ga(‘
    adsbygoogle
    ShopifyBuy
    widget.trustpilot.com
    ft.sdk.min.js
    apps.elfsight.com/p/platform.js
    livechatinc.com/tracking.js
    LiveChatWidget
    /busting/facebook-tracking/
    olark

    11. Identify Your Slowest Plugins

    Query Monitor and WP Hive are great tools for finding slow plugins.

    Query Monitor has a “queries by components” tab which shows your slowest loading plugins.

    Query Monitor Slow Plugins

    WP Hive is a Chrome Extension that adds a little section when searching the WordPress repository that shows whether a plugin has an impact on memory usage or PageSpeed Insights.

    WP Hive

    Otherwise, eliminating unnecessary plugins and replacing high CPU plugins with lightweight plugins is an ongoing process that can take time, but can prevent enormous network payloads.

    12. Use An Efficient Caching Plugin

    WP Rocket and LiteSpeed Cache are the gold standards for cache plugins.

    If you’re using a LiteSpeed Server, use LiteSpeed Cache. Otherwise, I would personally use WP Rocket for nearly all other cases (with the exception of SG Optimizer on SiteGround, but I don’t recommend their hosting as they have a slow TTFB).

    Which cache plugin you’re using and how you configure the settings has a large impact on your web vital scores. Make sure you test each setting (specifically the file optimization tab in WP Rocket) to see how each setting impacts scores and load times.

    13. Avoid Enormous Payloads With WP Rocket

    WP Rocket says they can help avoid enormous payloads with:

    • Browser caching
    • Minify CSS
    • Minify JavaScript
    • Delay JavaScript Execution
    • Lazy Load for images and iframes

    You’ll want to enable these in your WP Rocket settings.

    14. Take Advantage Of Server-Side Caching

    Most cloud hosts have server-side caching built-in to their dashboards.

    Redis, Memcached, and Varnish are all types of caching that can reduce network payloads. I use Cloudways and have Redis enabled which is a popular, efficient caching option. SiteGround has NGINX-based delivery which is available in Site Tools, and Kinsta has its own caching as well.

    Server-side caching is faster than file-based caching done by the cache plugin. Take advantage of it.

    Hosting-Application-Services

    15. Reduce Number Of Elements On The Page

    Reducing the number of elements on your pages will reduce page size and network payloads.

    • Reduce images
    • Reduce videos
    • Reduce sliders
    • Reduce featured posts
    • Reduce social media feeds
    • Break blog comments
    • Show smaller excerpts

    Cheers,

  • How to avoid an excessive dom size in wordpress

    How to avoid an excessive dom size in wordpress

    If you’re reading this article, chances are you’ve run into an “Avoid an excessive DOM size” warning from Google Lighthouse.

    Part of selecting a good theme choice in WordPress is to avoid an excessive DOM size. Before you install the theme on your website, do some research on other websites that utilize it. Verify the performance of those websites with Google PageSpeed Insights.

    The loading performance of a web page is one of the factors that influence getting good SEO positioning. And this is a topic where the DOM size of a page is critical.

    When a website is assessed using page speed tools such as Google Page Speed or GTmetrix, the error ‘Avoid an excessive DOM size’ displays. If you’re unfamiliar with the word and want to learn more about it, you’ve come to the correct spot. This post will cover everything you need to know about avoiding an excessive DOM size in WordPress.

    What is the DOM?

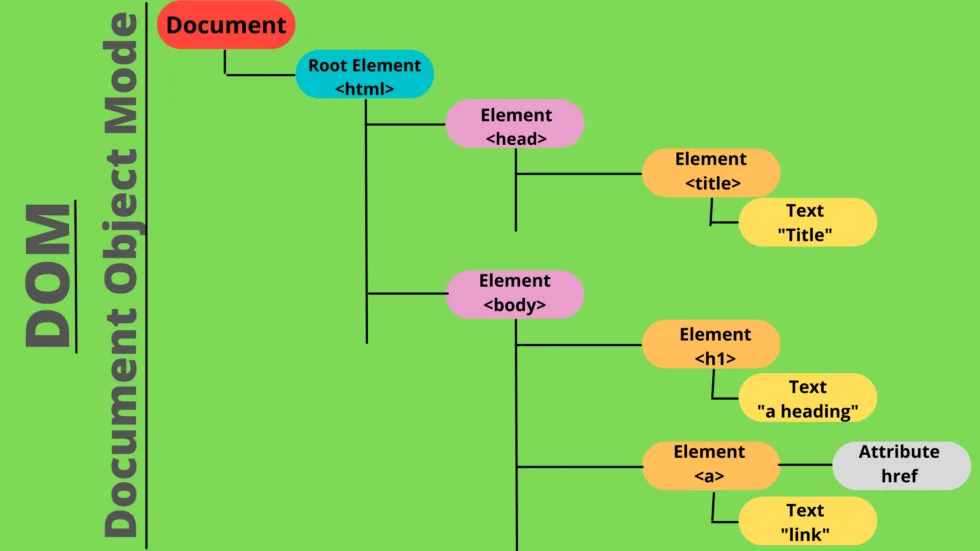
    Your browser creates a tree structure of the objects called DOM (Document Object Model) every time it loads a web page.

    DOM is a tree diagram of objects in your HTML. It shows each HTML element such as the body or h1 with its own node.

    DOM represents the hierarchical nature of different objects which may or may not depend on each other. As mentioned earlier, it displays the webpage’s HTML structure as a tree, composed of a series of tags.

    Here’s how it works: when your web browser starts preparing a page to display it, it generates an object tree diagram of all the page elements according to its HTML structure.

    As a result, whenever it receives an HTML file, it begins by converting it into a tree-structured form called DOM or DOM tree. You can access the DOM and modify it using JavaScript.

    Here are some key terms related to DOM:

    • Nodes. Each element or tag in the DOM is called a node or leaf in the DOM tree.
    • Depth. The number of elements in a branch of a DOM is called depth.
    • Child element. The last node which doesn’t branch any further is called a child element.

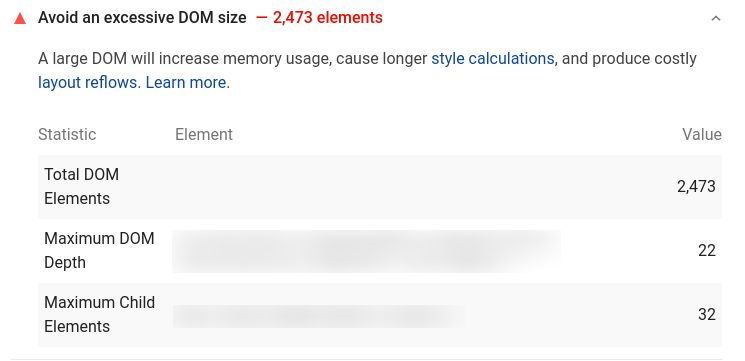
    When analyzing your site through Google PageSpeed Insights you might have seen an error like “Avoid an excessive DOM size”:

    Or in GTmetrix “Reduce the number of DOM elements”:

    How DOM Size Impact Performance?

    Excessive DOM size can impact performance in different ways.

    • Higher parse and render time (FCP) – A large DOM tree and complicated style rules make a huge work for the browser. The browser has to parse the HTML, construct a render tree, etc. Every time user interacts or something in HTML changes, the browser has to compute this again.
    • Increases memory usage – Your JavaScript code might have functions to access DOM elements. A larger DOM tree causes JavaScript to use higher memory to process these. An example would be a query selector like document.querySelectorAll('img') which lists all images, commonly used by lazy loading libraries.
    • Increases TTFB – As your DOM size increases, the size of the HTML document increases (in KBs). Since more data has to be transferred over the network, this increases TTFB.

    How to avoid an excessive dom size Technically?

    For example, technically reducing DOM size is simple as:

    use:

    <ul id="navigation-main">
        etc..
    </ul>

    instead of:

    <div id="navigation-main">
        <ul>
            etc..
        </ul>
    </div>

    Basically, get rid of every possible HTML element. You can also use Flexbox or Grid to further reduce DOM size.

    But since you’re using WordPress, this isn’t gonna help you much!

    How to avoid an excessive DOM size in WordPress?

    Lazy Render below-fold contents

    You can tell the browser to lazy render the contents (or elements) if it’s not required for the above fold. It’s just like lazy loading images, but for HTML elements.

    Split large pages into multiple pages

    Do you have a page with everything you got on the site? Like services, contact forms, products, blog posts, testimonials, etc?

    Try to split them into multiple pages and link to them from the header/navbar.

    Lazy load and Paginate everything possible

    Lazy load every possible element. Some examples could be:

    • Lazy load YouTube videos – use WP YouTube Lyte or Lazy Load by WP Rocket.
    • Limit number of blog posts/products per page – I usually try to keep a maximum of 10 blog posts per page and paginate rest of them.
    • Lazy load blog posts/products – Add “load more” button or infinite scroll to load more blog posts or products.
    • Lazy load comments – I lazy load comments section using Disqus Conditional Load since I use Disqus. If you’re using native comments, use plugins like Lazy Load for Comments.
    • Paginate comments – If you have hundreds of comments, this can also affect DOM size. Paginate comments by going to Settings -> Discussion -> Break comments into pages.
    • Limit related posts count – Try to limit the related posts count to 3 or 4.

    Note: Lazy loading images won’t reduce DOM size

    Don’t hide unwanted elements using CSS

    Sometimes you might need to remove elements injected by the theme/builder. For example, add to cart button in product pages, rating button, author info, published date, etc.

    A quick solution is to hide them using CSS:

    .cart-button {
      display:none;
    }

    Even though this solution looks easy, you’re serving unwanted code to users (which includes both HTML markup and CSS styles).

    Check your theme/plugin settings to see if there is an option to remove it. Otherwise, find the respective PHP code and remove/comment on them.

    Use well-coded themes and page builders

    A good theme has a major role in DOM size. Use well-coded themes like GeneratePress or Astra.

    Page builders also inject too many divs. Use builders like Oxygen that doesn’t inject unwanted divs and have more control over the HTML structure.

    If you’re new to Oxygen, watch Building a Website in Oxygen from Scratch.

    Conclusion

    There might be more plugins or theme settings that inject too many divs. An example can be “mega menu” plugins like UberMenu.

    Sometimes these are crucial for your website’s user experience. But sometimes these are never used by users.

    Maybe your footer links are never clicked because most of the visitors are only scrolling up to 75%.

    Use tools like HotJar or Google Analytics events to see what visitors are actually using and not using. Analyze, measure, and iterate.

    Hope this helps! 🙂


    WordPress Speed Optimization Service

  • 9 Tips to Improve First Contentful Paint in WordPress- FCP

    9 Tips to Improve First Contentful Paint in WordPress- FCP

    In early 2019, Google announced that they would evaluate a website’s speed ranking by focusing on two performance metrics: First Contentful Paint (FCP) and First Input Delay (FID).

    Over time, the performance scenario has evolved. For instance, Google announced the three Core Web Vitals: Largest Contentful Paint (LCP), Cumulative Layout Shift (CLS), and First Input Delay (FID).

    Nonetheless, the First Contentful Paint metric has continued to play an important role as a Lighthouse (and user experience) metric. It accounts for 10% of the overall performance score.

    Your website may load under 2 seconds in a speed test, but if that’s not the case for a majority of your audience, then Google will still penalize you.

    In this article, you’ll learn what’s FCP and why it’s important. Next, we’ll move on to various ways you can improve FCP on your WordPress site.

    Sounds exciting? Let’s dive in!

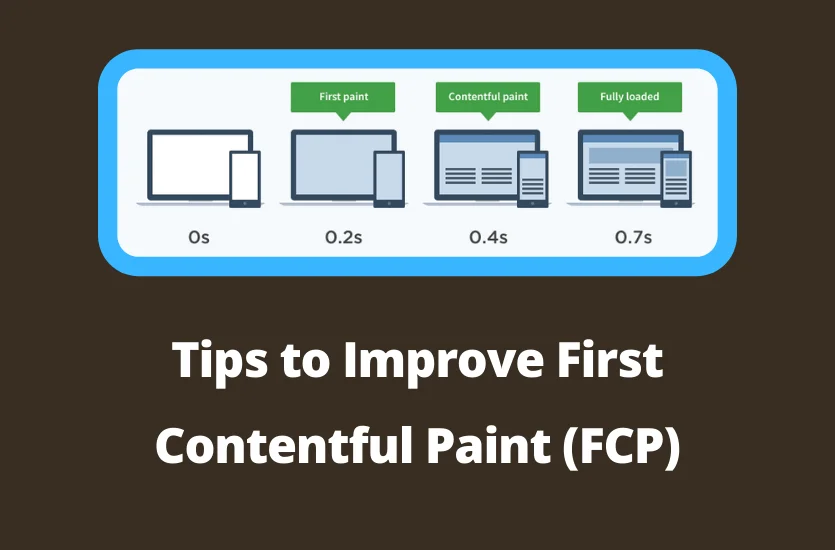
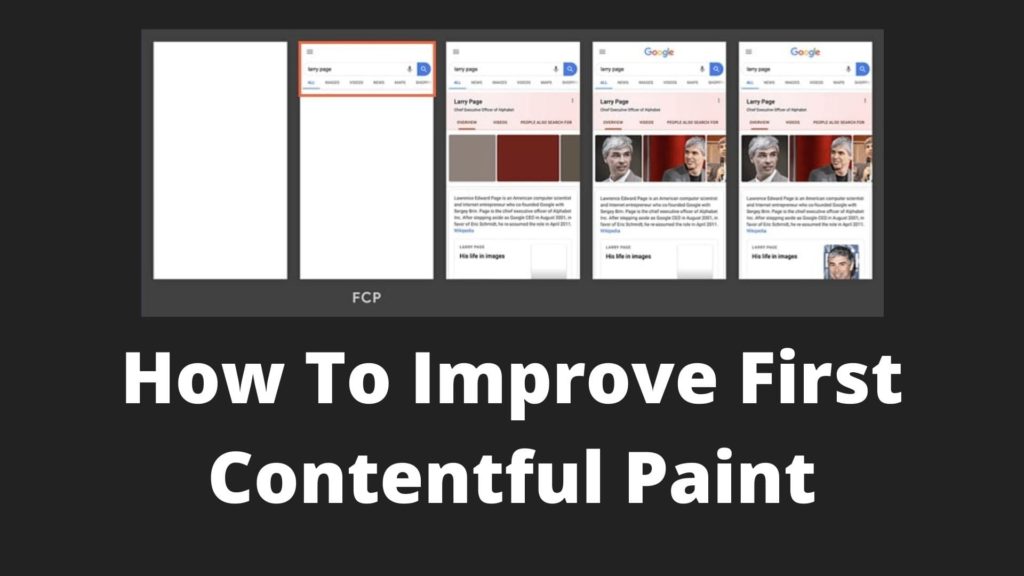
    What is First Contentful Paint (FCP)?

    First Contentful Paint (FCP) is a user-centric metric for measuring perceived page load speed. FCP measures how users perceive the performance of a website, rather than what a speed test tool measures.

    First Contentful Paint differs from First Paint, which is a point in the page load timeline where any type of render is detected on the browser. On the other hand, FCP requires some content to be rendered. This content could be text, images (including background images, logos), or non-white <canvas> elements.

    First Contentful Paint also differs from the Largest Contentful Pain (LCP), one of the Core Web Vitals measuring how long it takes for the largest element to become visible in the viewport.

    To keep it simple, you can think of FCP as the time it takes for the user to see any content on their browser. Thus, a fast FCP reassures the user that something is happening and keeps them glued to the site.

    Google recently made an announcement that they’re ranking websites based on FCP and FID.

    They categorize websites into Slow, Moderate and Fast

    This is now visible in Google Search Console‘s ‘Speed’ menu.

    This is also visible in Google PageSpeed Insights as ‘Field Data’.

    “But my website loads in 2s” Why does this matter?

    The Field Data is the data collected from the Chrome User Experience Report (Crux). Chrome collects data from real users.

    Your testing tools might say your website loads in 2s or less. But your audience might be from different locations, with different devices and network speed.

    Field Data tells the actual speed that your users are experiencing.

    So if you’re trying to figure out how to reduce FCP, here are some tips:

    1. Reduce TTFB

    FCP = TTFB + render time.

    So you’ve to reduce TTFB to reduce FCP.

    There are several techniques to reduce TTFB in WordPress. The easiest one is to use a good cache plugin like WP Rocket and a good hosting provider like Cloudways.

    2. Remove Render-blocking resources

    Once the browser receives the HTML content, it may have to download extra resources in order to start rendering.

    They’re usually CSS and JavaScript.

    For JavaScript, you’ve to add a defer attribute to the script tag. The defer attribute tells the browser to only execute the script file once the HTML document has been fully parsed.

    For CSS, we’ve to load them at the bottom, asynchronously.

    Almost all cache plugins can do both. What I usually recommend is WP Rocket since it can generate critical CSS too.

    Generate Critical CSS

    When you load CSS asynchronously, the browser doesn’t have the necessary styles required. This will create Flash of Unstyled Content of FOUC.

    To prevent this, we’ve to generate Critical CSS.

    Critical CSS is the CSS that is required to render the above fold contents. It’s inlined in the HTML so that no resources need to be downloaded and the browser can immediately render the content.

    3. Use well-coded themes and page builders

    A good theme has a major role in reducing FCP. Use well-coded themes like GeneratePress or Astra.

    Page builders also inject too many divs and unwanted CSS. Use builders like Oxygen that doesn’t inject unwanted divs and has more control over everything.

    If you’re new to Oxygen, watch Building a Website in Oxygen from Scratch.

    4. Avoid JS dependent elements in Above Fold

    Anything that requires JavaScript to be executed to render can harm First Contentful Paint.

    So as a thumb rule, avoid elements that require JavaScript to render in the above fold, like these:

    • Sliders like Revolution slider
    • Google Ads
    • Mega Menu plugins
    • Animations

    5. Preload Pages in the Background

    By preloading pages in the background, whenever a user navigates to a page, the page is loaded instantly without any delay.

    Link prefetching is a browser mechanism, which utilizes browser idle time to download or prefetch documents that the user might visit in the near future.

    Mozilla Docs

    Note that this will not help for the initial page load, only for the inner pages.

    The code looks like this:

    <link rel=”prefetch” href=”URL_TO_PAGE”>

    6. Exclude ‘Above Fold’ Images from Lazy Loading

    Lazy loading usually requires JavaScript to be executed before displaying images. This can delay rendering images in the above fold.

    Always exclude images in the above fold from lazy loading. Most of the lazy loading plugins have this feature.

    7. Inline ‘Critical’ Images

    Inlining images mean the browser doesn’t have to make another HTTP request to download the image. The content of the image is already inside the HTML.

    A normal image in HTML:

    <img src=”https://yout-site.com/logo.png”/>

    A base64 image in HTML (inlined):

    <img src=”data:image/png;base64,…[content]…”/>

    8. Reduce DOM Size

    When your browser receives an HTML document, it has to be converted to a tree-like structure which is used for rendering and painting with the help of CSS and JavaScript.

    This ‘tree’ like structure is called DOM or Document Object Model.

    The more elements you add into a page, render time and First Contentful Paint increases.

    9. Ensure Text Remains Visible during webfont load

    You may have seen an error like this in Google PageSpeed Insights:

    Font files are usually added in the CSS files.

    For a browser to get the fonts ready, it has to parse HTML, download CSS files, parse them, and download fonts files.

    Until these all are done, the text is invisible! Also called Flash of Invisible Text (FOIT).

    You can fix this by adding a display:swap to CSS (@font-face). This tells the browser to use a default font until the actual one is downloaded.

    Conclusion

    As Google has started to put more focus on site speed, improving FCP is no longer a ‘good to have’, it’s a ‘necessity’.

    Not just Google, FCP and FMP are the metrics which says when a site is ‘visible’ to the user. Measuring fully loaded time is not always enough.