Tag: Performance audit tools WordPress site

  • Low Score In Google PageSpeed Insights Or Lighthouse Mobile Test?

    Low Score In Google PageSpeed Insights Or Lighthouse Mobile Test?

    We get emails every day from website owners, telling us their site is fast but slow on mobile. Nine time out of ten they’ve tested their site on Google PageSpeed Insights (PSI) and the mobile score is low.

    Long story short, a low PageSpeed Score in mobile does not mean your site is slow on a mobile device. Pagespeed Insights is not a real speed test – it’s a technical checklist test. There are some important things to understand and keep in mind when it comes to the Mobile Pagespeed Score we’ve explained below.

    If you’re into tech stuff, there’s a great discussion on Github here about the credibility of Lighthouse/PSI mobile score.

    1. They’re testing your site on a speed limited, CPU limited connection

    Mobile PageSpeed simulates at 1.6mb/second connection – that is REALLY slow in modern internet speed terms. A moderately sized page of say 1.5-2mb is going to score low on this test simply because of the amount of time that data takes to download.

    The CPU limiting they do also causes sites that have even moderate amounts of javascript to be marked down heavily. The modern web runs on javascript and many WordPress themes require a javascript library called Jquery in order to render which means they automatically score lower.

    They of course don’t tell you this anywhere on the report itself, it’s hidden deep in the technical documents.

    2. Pagespeed Insights Isn’t a Speed Test, It’s a Technical Checklist

    Pagespeed Insights is more concerned with measuring your site against a technical checklist that correlates with speed rather than the raw speed of the site itself.

    The latest version of Pagespeed Insights does take into account some speed elements but it’s still largely concerned with checking boxes.

    3. Geography & Location Is Ignored

    PSI completely ignores geography and doesn’t take into account where your visitors are located and where your hosting is. This means its speed test is not necessarily true to the real world. If your hosting is in Australia and your customers are in Australia but the speed test elements of PSI are performed from the US then it’s not a true-to-life test.

    4. Website Speed Is Not Just Your Homepage

    This is something 99.9% of webmasters running speed tests completely miss – website speed is not just your homepage. Every page on your site is important when it comes to speed and testing the homepage is useful but is a bit of a 1-dimensional approach, you should probably be looking at all pages.

    5. High PageSpeed Score Will Likely Not Improve Your SEO

    There’s a misconception that a high PageSpeed Score means that the Google Gods will gift magical SEO rankings. This is not the case – for starters, see the previous point.

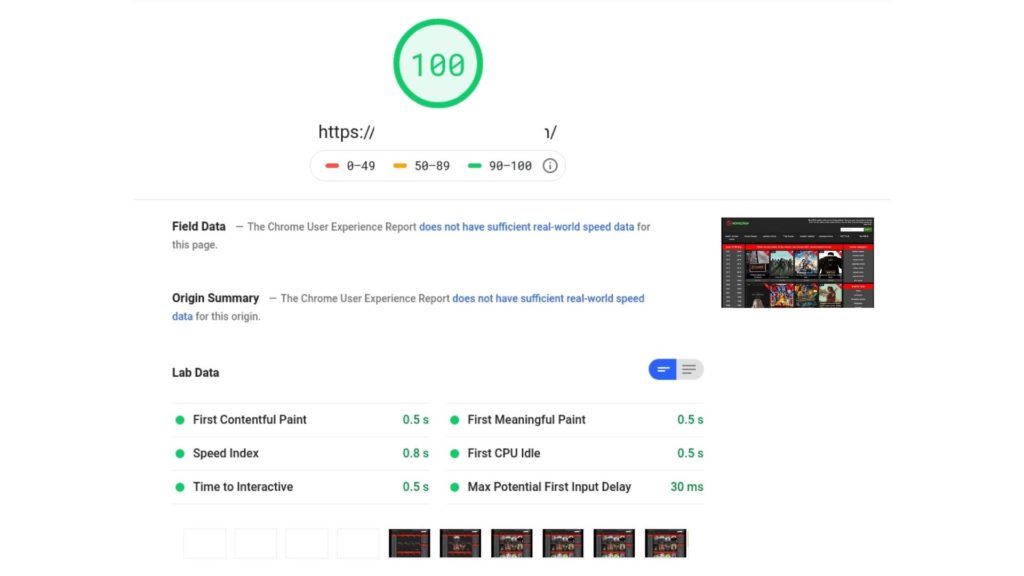
    Second, to that, achieving a 100 score especially on a WordPress site is extremely difficult unless you break the render of the site OR switch to a theme that does not use jquery – this article talks through the Fastest WordPress Themes in more detail.

    We’ve seen SEO consultants and webmasters spend days obsessing over Pagespeed score in the hope it will boost SEO. Your time would be better spent on other SEO tasks like optimizing your meta descriptions for CTR or optimizing your open graph tags to boost social CTR.

    6. The Score Varies Wildly From Test to Test

    Run multiple tests and you’ll see the score varies wildly often by 20-30 points. That’s partly a function of geography but these inconsistencies make it difficult to trust the tool.

    That’s all folks!

    Really hope this helped! If it did, drop me your new scores + load times via email 🙂

    Cheers,
    Hafiz
  • 14 Tools We Use to Audit Performance of a WordPress site

    14 Tools We Use to Audit Performance of a WordPress site

    Performance is not just about “my site loads under x seconds”. There are several other factors you need to look into.

    Here is a list of tools and services I use to audit or test the performance of a WordPress site. Not just WordPress, these can be used for any site.

    1. Your Eyes – The Eye Test

    Don’t get me wrong.

    Let’s take an example,  Wp-Rocket WordPress plugin. It helps to prefetch inner pages in the background and loads pages instantly on user navigation. This gives a much better user experience.

    I haven’t seen any tools who can measure these.

    Whether your tools give you the perfect score or loads in a few hundred milliseconds, always test your site through naked eyes.

    2. Chrome Developer Tools

    Google Chrome Developer Tools comes with several handy tools to audit a website. Open developer tools by Ctrl+Shift+I or Ctrl+Opt+J.

    2.1 Network Monitor

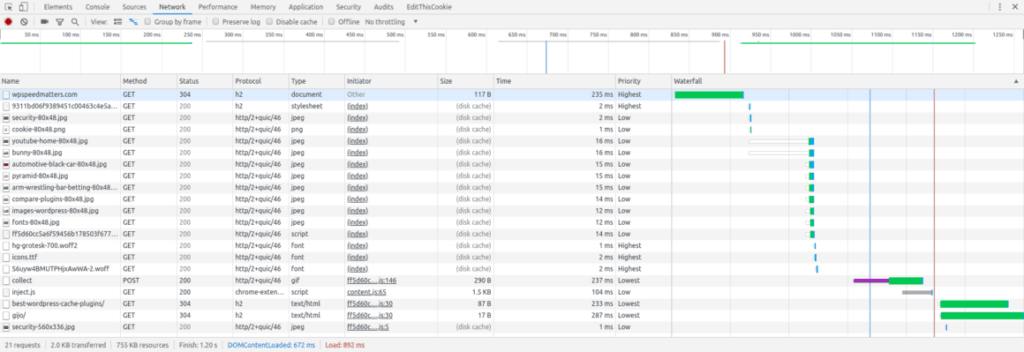
    Network monitor gives a detailed view of what all requests are made by the browser, its response, timings etc.

    • Status – Easy to figure out if any resource is not available
    • Protocol – Checks HTTP1.1, HTTP2, Quic etc
    • Type – File type returned, easy to figure out WebP is working
    • Size – Amount of data transferred, with and without Gzip. ‘Disk Cache’ or ‘Memory Cache’ indicates browser caching is working
    • Priority – Priority of each file which browser requests. CSS, JS, Fonts have high priority, images – Low, SendBeacon (Google Analytics), prefetch (Wp-Rocket) have the lowest.
    • Waterfall – A waterfall of the data requested and received. Also, provide in-depth data of DNS lookup, TCP connection, SSL, TTFB, etc. Easy to debug lazy loading too

    2.2 Audits

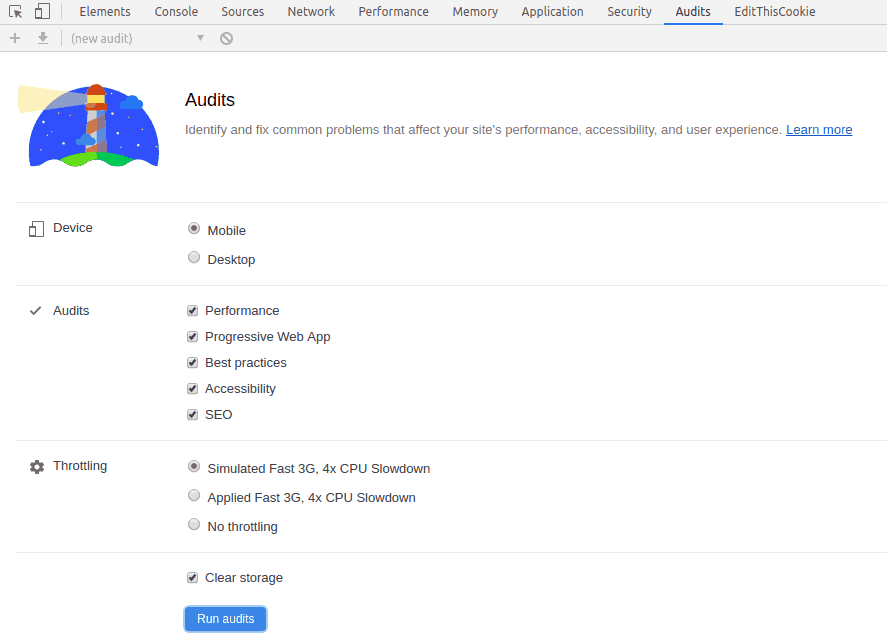
    Test your site for performance, PWA, best practices, accessibility and SEO. You can also choose device and throttle network speed and CPU.

    You can use the ‘Lighthouse’ tool which I mentioned below to get the same results.

    2.3 Security


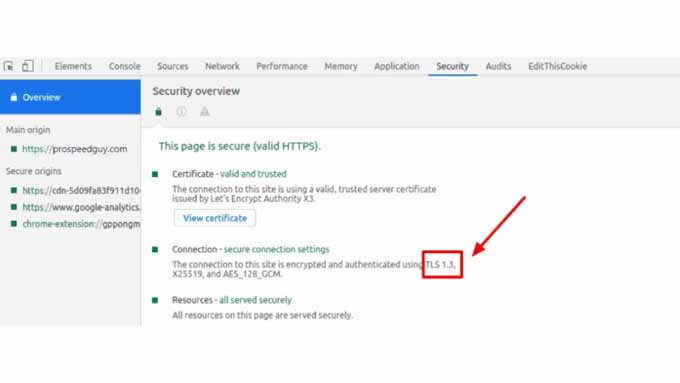
    How does security relate to performance?

    The version of TLS can dramatically affect the TTFB. The latest version is TLS 1.3.

    3. Google PageSpeed Insights

    Google PageSpeed Insights is one my favourite tool among all. What I like about it is, instead of just focussing on ‘load time’, it measures user experience up to a point.

    Some people complain that it doesn’t show fully loaded time. I believe Google doesn’t show it because it’s not a good way to measure a site.

    Google PSI is one of the best tools to analyze:

    • TTFB – Time to First Byte (server response time)
    • FCP – First Contentful Paint
    • FMP – First Meaningful Paint
    • TTI – Time to Interactive

    and more

    4. GTmetrix Analyzer

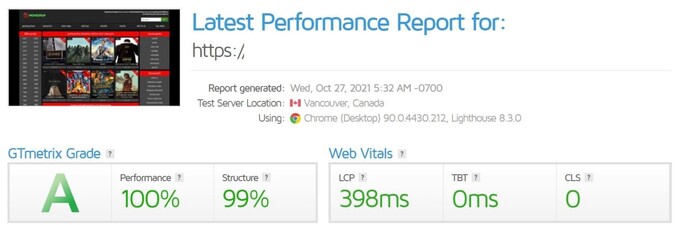
    GTmetrix will analyze your site and can recommend what all things are needed to be fixed. Also, give you some scores and fully loaded time. You can also choose the region for test, device, browser etc.

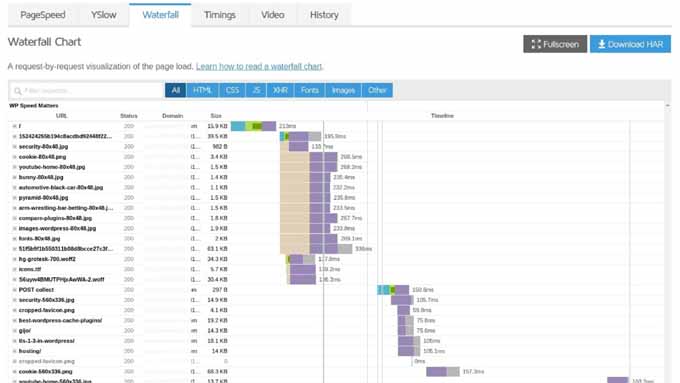
    GTmetrix provides a Waterfall of all the requests made from the website, which I found very useful.

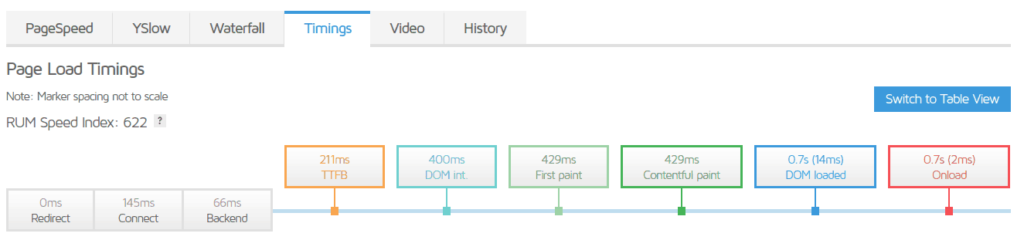
    Most of the time people look into scores and fully loaded time. The factors that I mainly look into are in the ‘Timings’ tab.

    5. GTmetrix Monitor

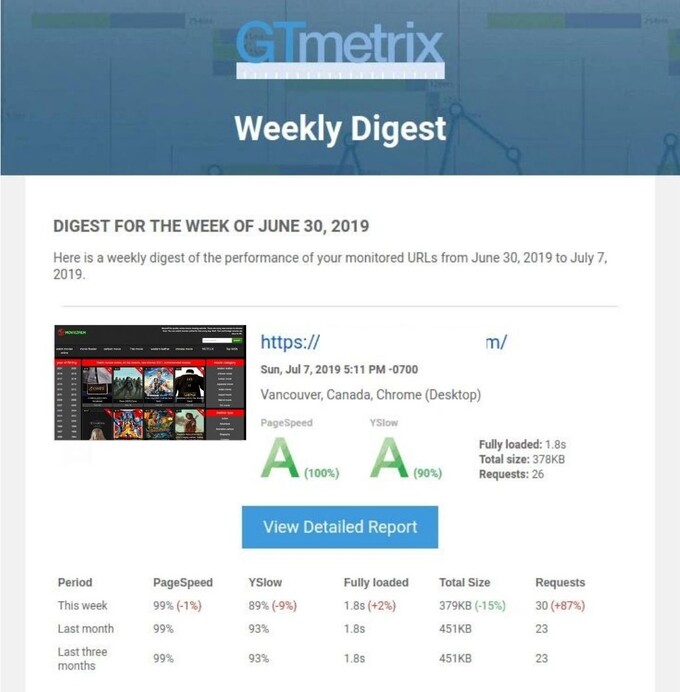
    GTmetrix also comes with a monitor that will periodically check your site and send you a weekly digest. I no longer have to analyze my site again and again if I update something in my site.

    Their free plan (Basic plan) provides 3 URLs to monitor.

    6. Pingdom Speed Test

    Pingdom Speed Test is a free tool provided by the SolarWinds. It’s is very similar to GTmetrix, provide you with a report with scores and load time.

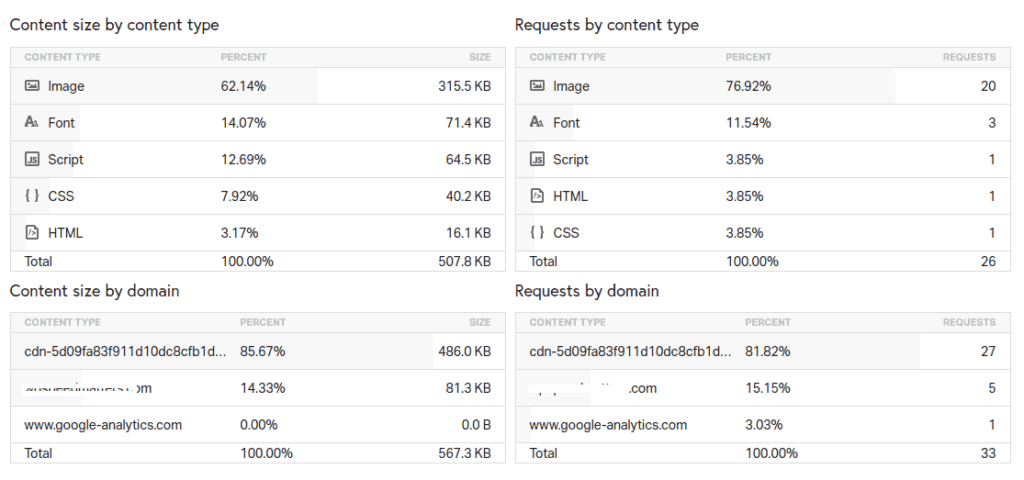
    But what I like about this tool is that it shows a breakdown of size and no. of requests per domain, file type etc. This gives a quick view of where to optimize.

    7. Pingdom Monitoring

    What if your server is going down occasionally or your site is inaccessible to some users on heavy traffic?

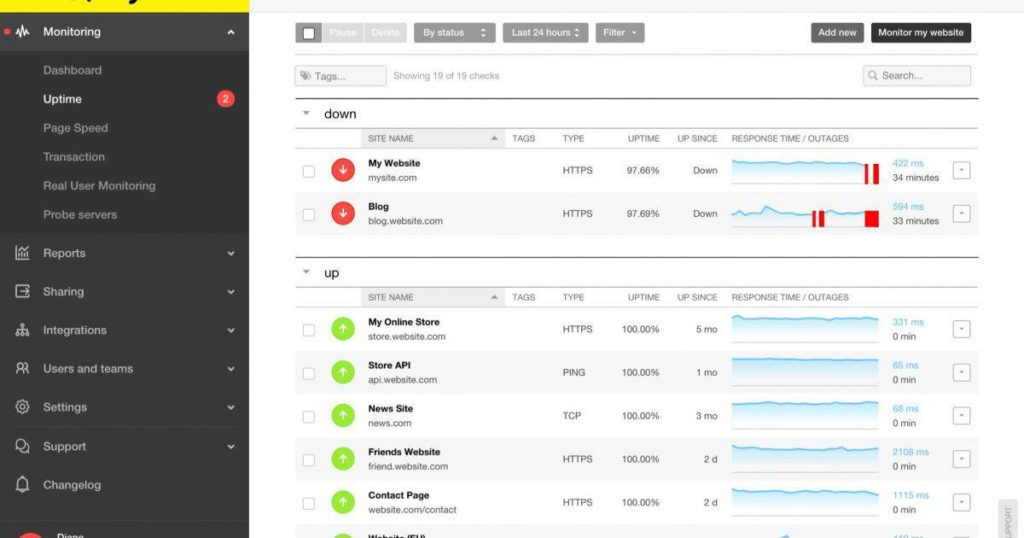
    Pingdom is a ‘Website Performance and Availability Monitoring’ company. Pingdom monitor will continuously monitor (say every 5 mins or 30 secs) and will alert you if something goes wrong.

    There is no free plan. Paid plan starts at $14.95/month.

    8. WebPageTest

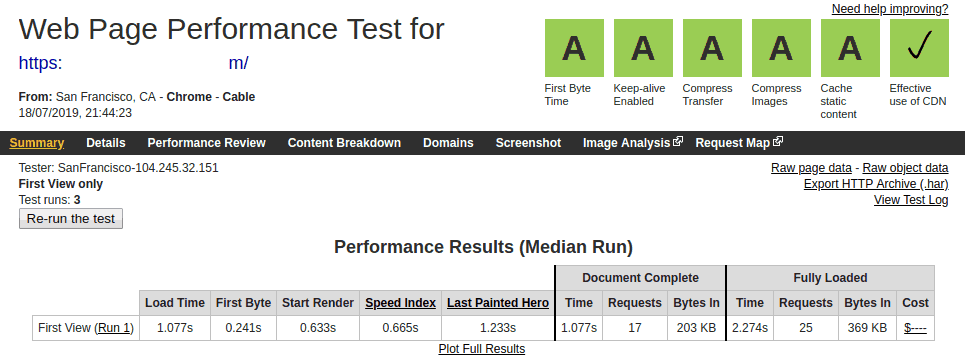
    WebPageTest is one of the oldest and reliable tools. Test your website multiple times from the same device. It’s very useful to see how effectively “browser caching” is working. Also provide some key metrics like TTFB, keep-alive, compression, browser caching, cdn etc.

    I’m not a big fan of their UI 😉 so I don’t use it that often.

    9. KeyCDN Performance Test

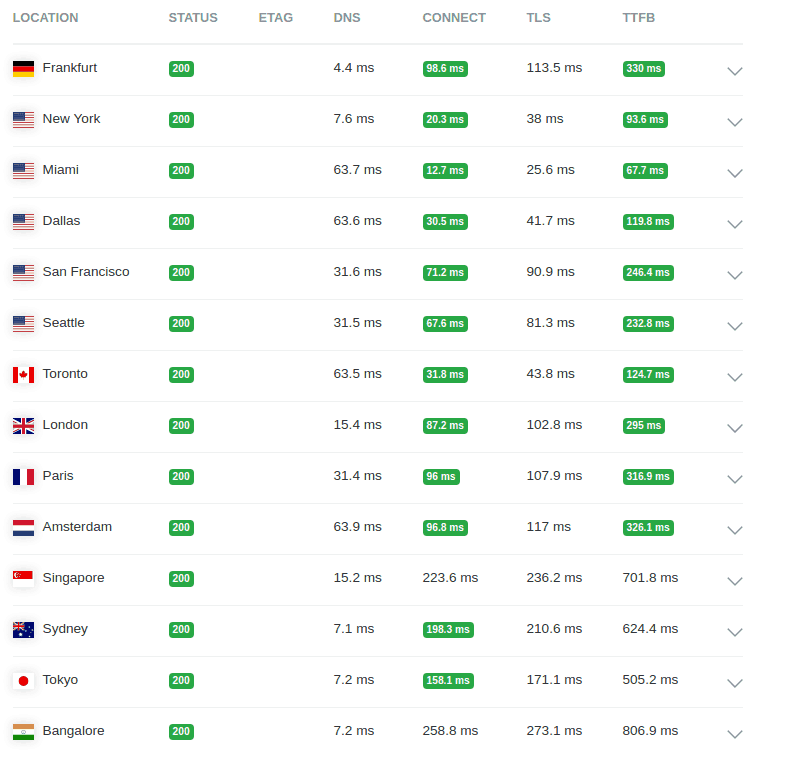
    Most of the tools I listed above will test TTFB (time to first byte or server response time) from a single location. KeyCDN Performance Test will analyze your site from 14 locations with just a button click and provide a report of DNS lookup time, connection, TLS and TTFB.

    10. Uptime Robot

    Similar to Pingdom Monitoring, Uptime Robot monitors your site for the downtime and will alert you.

    The free plan allows 5 mins of monitoring intervals.

    It’s highly recommended to monitor your hosting/server, especially if you’re on a shared hosting

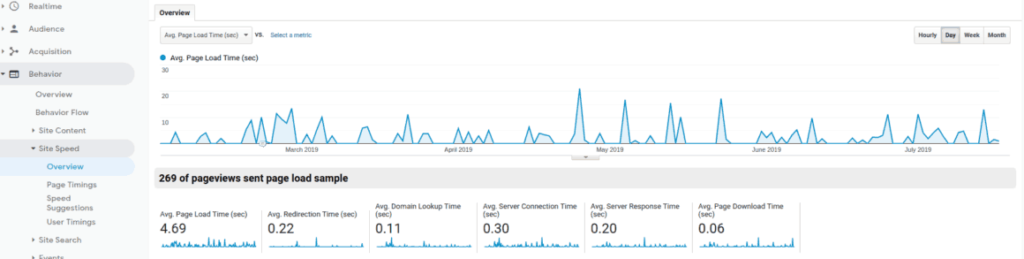
    11. Google Analytics Site Speed

    Google Analytics uses HTML5 Navigation Timing API to collect performance metrics from 1% of your users (configurable). You can view it under Behaviour -> Site Speed.

    What’s so special about GA Site Speed is that data is collected from real-world usage. All other tools use the high-performance network or an emulated network to do the test, which might be different from real users. What if most of your users are still on 3G?

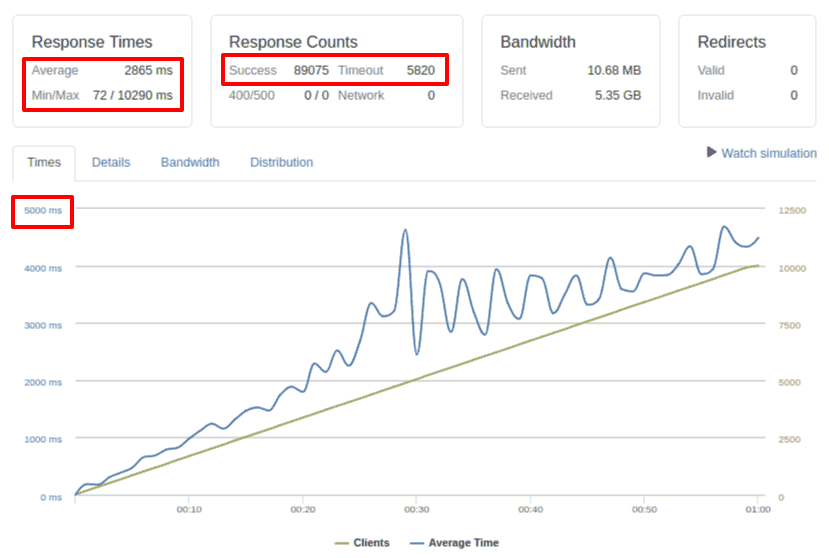
    12. Loader.io

    What if one of your blog posts went viral? Are you sure that your server/hosting provider could handle it? You might be losing a good amount of users and affecting SEO badly without your knowledge.

    Don’t assume and believe in “unlimited” traffic. Better do a load test and figure out how many visitors you can handle.

    Loader.io makes it easy to send 10k requests/second to your site and see how it performs.

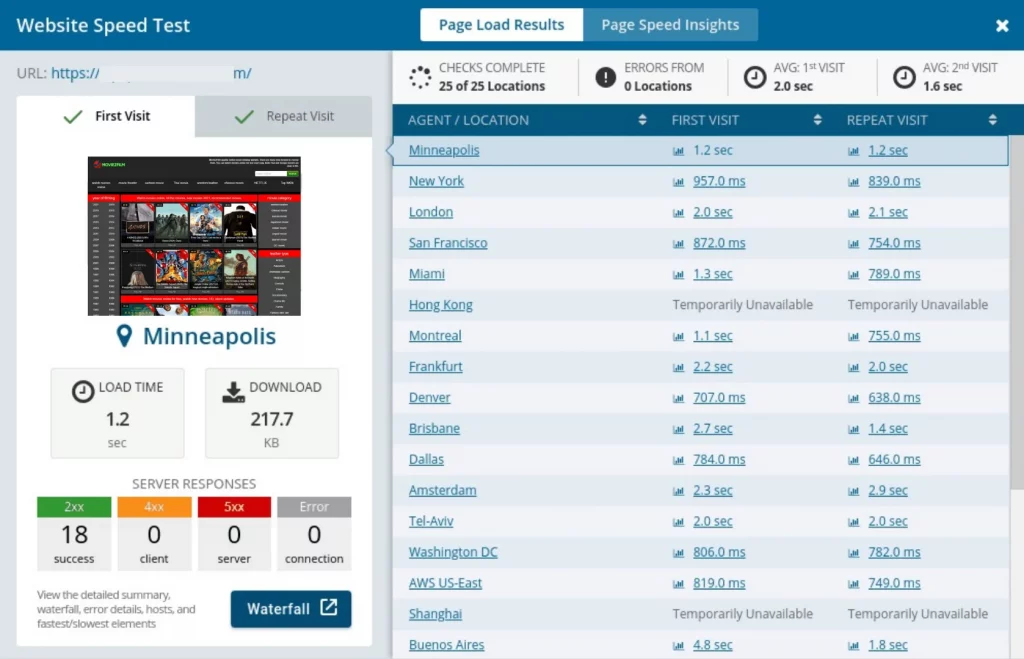
    13. dotcom-tools

    dotcom-tools tests your site from 25 locations, both first and repeat first. I also use this tool to prebuild cache of CDN after a purge.

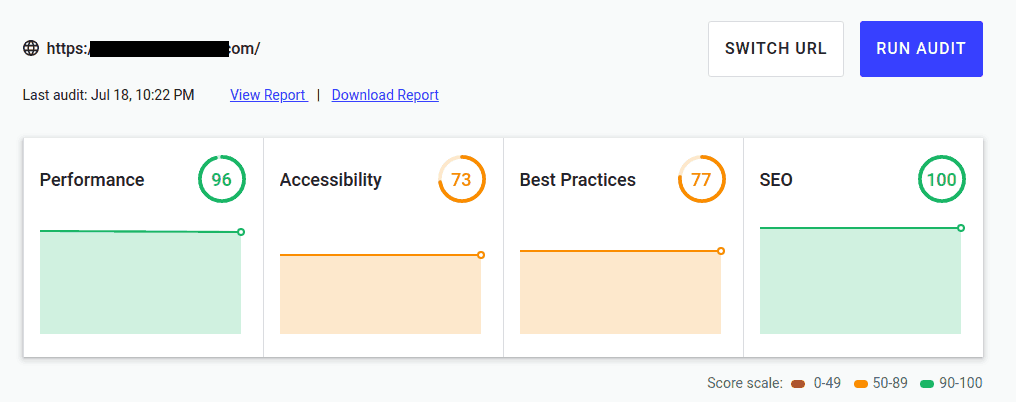
    14. Lighthouse

    Lighthouse is another tool provided by Google. It’s built inside Google Chrome.

    Lighthouse tests Performance, Accessibility, Best Practices and SEO. The ‘Performance’ report will be the same as in Google PageSPeed Insights. But in a single tool, you can test all of them.

    You can test it directly from your Chrome Browser’s ‘Audits’ tab in developers tools or go to https://web.dev/measure